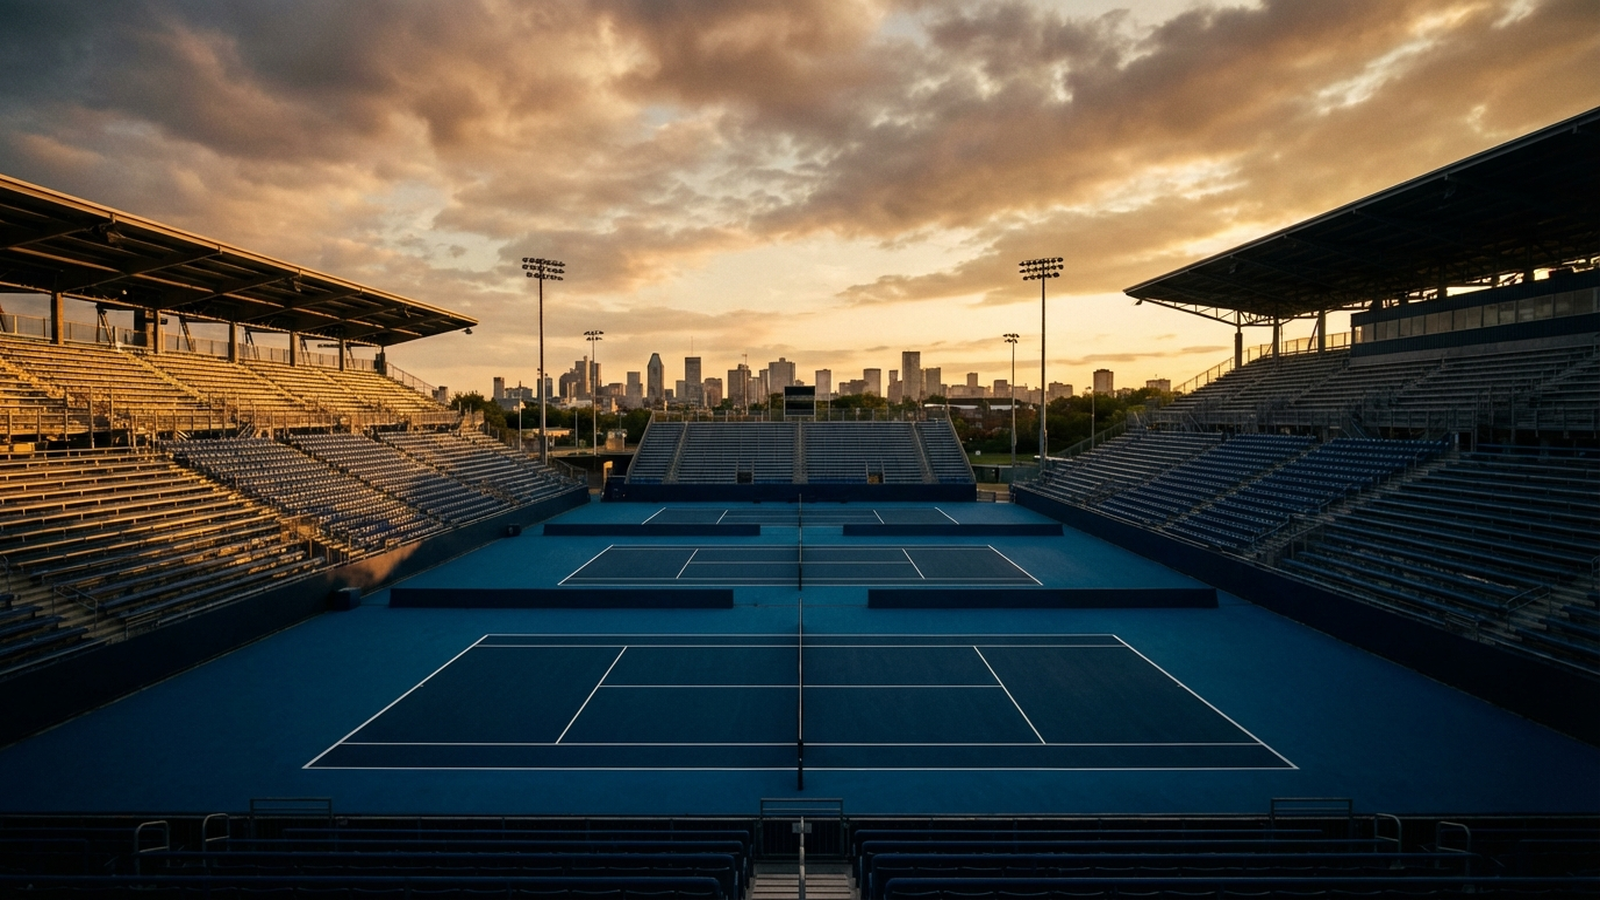
The Canadian Open 2026 — officially branded the National Bank Open — returns as one of the most prestigious hard-court events on the professional tennis calendar. Founded in 1881, this is the third-oldest tennis tournament in the world, trailing only Wimbledon and the US Open. It holds dual status as both an ATP Masters 1000 and a WTA 1000 event, making it one of the rare tournaments where the men’s and women’s tours converge — albeit in different cities each year. With a combined prize purse of $14.34 million and an expanded 12-day, 96-player main draw format, the 2026 edition promises to be one of the biggest yet.
According to TennisMattch.com’s database of 3,756 matches played at this tournament, the Canadian Open delivers a distinctive brand of hard-court tennis. Players average 4.63 aces per match — noticeably below the tour-wide average of 5.00 — while double faults run at 3.84 per match, higher than the tour average of 3.35. That combination points to conditions that punish free-swinging servers and reward returners, making this event a proving ground for the sport’s most complete players. It is no accident that Ivan Lendl, a relentless baseliner, holds the all-time record with 5 titles, or that Rafael Nadal claimed 5.
The 2025 edition shattered attendance records with a combined 504,860 spectators across Montreal (287,329) and Toronto (217,531). As the premier hard-court warm-up before the US Open, the Canadian Open 2026 occupies a critical slot in the August calendar — a place where form is found, rankings shift, and legacies are built. Below, we break down every angle: history, venue, serve data, break-point trends, match durations, rivalries, upsets, prize money, weather, and more.
Tournament History
No tournament in tennis can claim a longer continuous pedigree outside of the two oldest Grand Slams. The Canadian Championships were first staged in 1881, just four years after Wimbledon’s inaugural edition and six before the US National Championships (now the US Open). For more than a century, the event evolved — from a genteel national championship to one of the most lucrative and competitive stops on both the ATP and WTA tours.
From Canadian Championships to Masters 1000
The tournament’s early decades were defined by its status as a domestic affair, but the Open Era transformed it into an international spectacle. As prize money grew and the professional tours solidified their calendars, the event became a fixture on what is now the ATP Masters 1000 circuit. The WTA elevated its parallel women’s event to 1000-level status as well, giving the Canadian Open a dual identity unique among all professional tennis tournaments.
One of the tournament’s most distinctive features is its alternating-city format. The men’s and women’s draws swap annually between Montreal and Toronto, ensuring both cities share in the prestige. When the ATP event is in Montreal, the WTA event is in Toronto, and vice versa. This rotation has fostered two passionate fan bases and two world-class venues, giving the tournament a geographic breadth unmatched on tour.
The Naming Rights Journey
Longtime fans know this event by many names. It was the Canadian Open for decades, then became the Rogers Cup during a long sponsorship partnership with Rogers Communications. In recent years, the title sponsorship shifted to the National Bank of Canada, rebadging the event as the National Bank Open. Throughout these changes, the tournament’s identity as Canada’s premier tennis event has remained constant. Operated by Tennis Canada, a not-for-profit organization, the tournament funnels its net proceeds back into grassroots tennis development — building courts, funding coaching programs, and nurturing the next generation of Canadian talent.
A Legacy of Champions
The roll call of champions reads like a who’s who of tennis history. According to TennisMattch.com’s database, Ivan Lendl sits atop the all-time leaderboard with 5 titles (1980, 1981, 1983, 1987, 1988, 1989, 1990), compiling a staggering 62–9 win-loss record. Rafael Nadal follows with 5 titles, while Novak Djokovic and Chris Evert each claimed 4. On the women’s side, Monica Seles posted perhaps the most dominant stretch in tournament history, going 31–3 across her appearances and winning 3 titles. Serena Williams won 3 titles with a 35–7 record, while Simona Halep also captured 3.
More recently, the tournament has crowned a new wave of champions. Andy Murray accumulated 3 titles, Jessica Pegula broke through with 2, and Ben Shelton has already notched 2 title — all signaling that the Canadian Open continues to produce memorable moments for each generation of the sport.
| Year | Champion | Runner-Up | Score |
|---|---|---|---|
| 2025 | Ben Shelton (USA) | Karen Khachanov | 1 – 2 |
| 2024 | Alexei Popyrin (Australia) | Andrey Rublev | 6-2 6-4 |
| 2023 | Jannik Sinner (Italy) | Alex De Minaur | 6-4 6-1 |
| 2022 | Pablo Carreno-Busta | Hubert Hurkacz | 3-6 6-3 6-3 |
| 2021 | Daniil Medvedev (RUS) | Reilly Opelka | 6-4 6-3 |
| 2019 | Rafael Nadal | Daniil Medvedev | 6-3 6-0 |
| 2018 | Rafael Nadal | Stefanos Tsitsipas | 6-2 7-6(4) |
| 2017 | Alexander Zverev (Germany) | Roger Federer | 6-3 6-4 |
| 2016 | Novak Djokovic (Serbia) | Kei Nishikori | 6-3 7-5 |
| 2015 | Andy Murray | Novak Djokovic | 6-4 4-6 6-3 |
| 2014 | Jo-Wilfried Tsonga | Roger Federer | 7-5 7-6(3) |
| 2013 | Rafael Nadal | Milos Raonic | 6-2 6-2 |
| 2012 | Novak Djokovic (Serbia) | Richard Gasquet | 6-3 6-2 |
| 2011 | Novak Djokovic (Serbia) | Mardy Fish | 6-2 3-6 6-4 |
| 2010 | Andy Murray | Roger Federer | 7-5 7-5 |
| 2009 | Andy Murray | Juan Martin del Potro | 6-7(4) 7-6(3) 6-1 |
| 2008 | Rafael Nadal | Nicolas Kiefer | 6-3 6-2 |
| 2007 | Novak Djokovic (Serbia) | Roger Federer | 7-6(2) 2-6 7-6(2) |
| 2006 | Roger Federer | Richard Gasquet | 2-6 6-3 6-2 |
| 2005 | Rafael Nadal | Andre Agassi | 6-3 4-6 6-2 |
| 2004 | Roger Federer | Andy Roddick | 7-5 6-3 |
| 2003 | Andy Roddick | David Nalbandian | 6-1 6-3 |
| 2002 | Guillermo Canas | Andy Roddick | 6-4 7-5 |
| 2001 | Andrei Pavel | Patrick Rafter | 7-6(3) 2-6 6-3 |
| 2000 | Marat Safin | Harel Levy | 6-2 6-3 |
| Year | Champion | Runner-Up | Score |
|---|---|---|---|
| 2025 | Victoria Mboko (Canada) | Naomi Osaka | 2 – 1 |
| 2024 | Jessica Pegula (USA) | Amanda Anisimova | 6-3 2-6 6-1 |
| 2023 | Jessica Pegula (USA) | Liudmila Samsonova | 6-1 6-0 |
| 2022 | Simona Halep | Beatriz Haddad Maia | 6-3 2-6 6-3 |
| 2021 | Camila Giorgi | Karolina Pliskova | 6-3 7-5 |
| 2019 | Bianca Andreescu | Serena Williams | 3-1 RET |
| 2018 | Simona Halep | Sloane Stephens | 7-6(6) 3-6 6-4 |
| 2017 | Elina Svitolina (Ukraine) | Caroline Wozniacki | 6-4 6-0 |
| 2016 | Simona Halep | Madison Keys | 7-6(2) 6-3 |
| 2015 | Belinda Bencic (Switzerland) | Simona Halep | 7-6(5) 6-7(4) 3-0 RET |
| 2014 | Agnieszka Radwanska | Venus Williams | 6-4 6-2 |
| 2013 | Serena Williams | Sorana Cirstea | 6-2 6-0 |
| 2012 | Petra Kvitova | Na Li | 7-5 2-6 6-3 |
| 2011 | Serena Williams | Samantha Stosur | 6-4 6-2 |
| 2010 | Caroline Wozniacki | Vera Zvonareva | 6-3 6-2 |
| 2009 | Elena Dementieva | Maria Sharapova | 6-4 6-3 |
| 2008 | Dinara Safina | Dominika Cibulkova | 6-2 6-1 |
| 2007 | Justine Henin | Jelena Jankovic | 7-6(3) 7-5 |
| 2006 | Ana Ivanovic | Martina Hingis | 6-2 6-3 |
| 2005 | Kim Clijsters | Justine Henin | 7-5 6-1 |
| 2004 | Amelie Mauresmo | Elena Likhovtseva | 6-1 6-0 |
| 2003 | Justine Henin | Lina Krasnoroutskaya | 6-1 6-0 |
| 2002 | Amelie Mauresmo | Jennifer Capriati | 6-4 6-1 |
| 2001 | Serena Williams | Jennifer Capriati | 6-1 6-7(7) 6-3 |
| 2000 | Martina Hingis | Serena Williams | 0-6 6-3 3-0 RET |
The Modern Era: Expansion and Equity
The tournament has undergone a significant structural evolution in recent years. The main draw expanded to 96 players, and the event stretched to 12 days, giving players more rest between rounds and fans more opportunities to attend. Equally significant is the “Game. Set. Equity.” initiative, a partnership with National Bank designed to close the gender pay gap at the tournament. Under this plan, WTA prize money has been steadily increasing, with full parity with the ATP draw targeted by 2027. The 2026 edition — with its $14.34 million combined purse — represents another step toward that landmark goal.
Venue & Playing Conditions
The Canadian Open’s dual-venue setup is unique in professional tennis. In any given year, the ATP and WTA events are split between two purpose-built stadiums: IGA Stadium in Montreal and Sobeys Stadium in Toronto. The men’s and women’s draws alternate cities annually, ensuring both venues host top-tier competition.
IGA Stadium — Montreal
Located at 285 Gary-Carter Street in Montreal’s Jarry Park neighborhood, IGA Stadium has a centre-court capacity of 11,815. The facility was purpose-built for the tournament in 1996 and has undergone multiple upgrades since. Situated in the vibrant Villeray district, it offers proximity to some of Montreal’s most iconic attractions: Mount Royal, Old Montreal, and a thriving culinary scene. The venue’s location within Jarry Park itself provides a lush, green setting that contrasts sharply with the intense competition on court.
Sobeys Stadium — Toronto
Across the province, Sobeys Stadium sits on the York University campus at 1 Shoreham Drive in Toronto’s northwest corridor. With a centre-court capacity of 12,500, it is the larger of the two venues. The facility was built in 2004 and benefits from excellent transit access via the Pioneer Village station on Toronto’s subway line, connecting fans to downtown attractions like the CN Tower, Scotiabank Arena, and the entertainment district. Nearby, Black Creek Pioneer Village offers a quirky cultural detour for visitors with time before the evening session.
Surface and Playing Conditions
Both venues feature Har-Tru cushioned acrylic outdoor hard courts, which play slightly differently than the DecoTurf used at the US Open or the GreenSet Plexicushion of the Australian Open. The cushioned acrylic provides a medium-paced surface that rewards consistent ball-striking over raw power. According to TennisMattch.com’s database of 3,756 matches, the average first-serve percentage at this tournament is 60.12%, sitting just below the tour-wide average of 61.13%. That slight dip suggests the surface — combined with outdoor conditions in the Canadian summer — introduces enough variability in ball bounce to challenge even the most reliable servers.
In a notable sustainability effort, the centre court at Sobeys Stadium was resurfaced in 2023 using an eco-friendly acrylic mix that incorporated 1,400 recycled tennis balls from the previous year’s tournament. It’s a fitting innovation for an event operated by a not-for-profit organization committed to community impact. Additionally, official court surface partner Har-Tru donates $15 to the Play Your Court program for every ace hit during the tournament — funding the construction of community courts across Canada.
Serve Dominance
The Canadian Open has never been a server’s paradise, and the data confirms it. According to TennisMattch.com’s database of 3,756 matches, players average just 4.63 aces per match — a full 7.5% below the tour-wide average of 5.00. Meanwhile, double faults average 3.84 per match, which is 14.5% higher than the tour average of 3.35. That imbalance — fewer aces, more double faults — paints a clear picture: the conditions at this tournament make holding serve more challenging than at most hard-court events.
First Serve Efficiency
The average first-serve percentage across the tournament’s history is 60.12%, just a tick below the tour-wide mark of 61.13%. When that first serve does land, players win 68.74% of first-serve points — a healthy number that underscores the importance of finding the box. On second serve, however, the win rate drops to 48.27%, a figure that creates constant vulnerability for servers facing aggressive returners.
What does this mean tactically? The data suggests that the cushioned acrylic surface, combined with summer humidity and occasionally swirling winds, diminishes the serve’s dominance. Big servers cannot simply bomb their way through draws. Instead, the tournament rewards players who can construct points from the baseline after a quality first delivery — or who can defend their second serve with placement and spin rather than pace alone.
Year-by-Year Ace Trends
Recent editions show some interesting variation. In 2025, the ace average climbed to 5.32 per match — the highest in our sample — but so did double faults, which ballooned to 4.63. That suggests players were taking bigger risks on serve, perhaps influenced by the expanded 96-player draw that introduced more aggressive, lower-ranked players into the main draw. In 2024, aces dropped to 4.10 while double faults sat at 4.08 — a nearly 1:1 ratio that indicates extreme serving inconsistency across the draw. By contrast, the 2010 edition saw just 4.34 aces and 3.23 double faults per match, a cleaner ratio reflective of a draw dominated by consistent baseliners.
The key takeaway for the Canadian Open 2026? Expect return-oriented play to thrive. Players who can neutralize serves and put pressure on second deliveries have historically flourished on these courts. The sub-5.00 ace average is not a fluke — it’s a defining feature of this tournament.
Break Point Battles
If serves are slightly suppressed at the Canadian Open, break points should abound — and the data bears that out. According to TennisMattch.com’s database, the average break-point conversion rate at this tournament is 44.27%, virtually identical to the tour-wide average of 44.33%. That alignment might seem unremarkable at first glance, but it tells an important story: despite the serve-suppressing conditions creating more break-point opportunities, players convert them at the same rate as elsewhere on tour. This means the volume of break points — not just the conversion efficiency — is the differentiator.
Annual Fluctuations
The year-by-year data reveals significant swings. In 2024, the break-point conversion rate spiked to 45.70%, the highest in our recent sample. That edition saw the lowest ace average (4.10) and a first-serve percentage of just 57.75% — conditions that clearly favored returners. Contrast that with 2023, when conversion dropped to 42.07% despite a higher ace rate of 4.84. The 2023 draw may have featured more clutch servers who elevated their games on break points, or returners who struggled to capitalize in pressure moments.
Looking further back, 2009 posted a conversion rate of 45.35%, while 2008 came in at 44.76% — both above the tournament’s long-term average. The 2010 edition, by contrast, dipped to 42.37%, one of the lower figures in the dataset.
What This Means for 2026
For the Canadian Open 2026, the break-point data suggests that matches will be decided by a handful of key moments. With serves under constant pressure (4.63 aces vs. 3.84 double faults per match, on average), break-point opportunities will be plentiful. The players who can lock in during these clutch moments — either saving break points on serve or converting them on return — will advance deepest in the draw. Historically, the great champions of this event have been among the tour’s best returners: Lendl, Nadal, Djokovic, Agassi. That pattern is baked into the tournament’s DNA.
Match Duration
The Canadian Open produces matches that run slightly longer than the typical tour event. According to TennisMattch.com’s database of 2,214 matches with recorded durations, the average match length is 98 minutes, with a median of 93 minutes. That gap between mean and median suggests a distribution skewed by epic encounters — a handful of marathon matches pulling the average upward.
The Longest Match in Tournament History
The longest match on record is a staggering 213-minute R64 clash on August 8, 2022, in which Sara Sorribes Tormo outlasted Claire Liu 7-6(4), 2-6, 7-6(5). Three hours and thirty-three minutes for a first-round match — the kind of grind that defines the Canadian Open’s character. Both tiebreaks went deep, neither player could separate herself on serve, and the match became a war of attrition in the summer heat. The shortest match on record? A mere 14 minutes, likely a retirement, but a testament to the range of outcomes this tournament produces.
Duration by Round
The round-by-round breakdown reveals a counterintuitive pattern. Quarterfinals average 102.18 minutes — the longest of any round — followed by Round of 16 at 101.24 minutes and semifinals at 100.72 minutes. Finals, surprisingly, average just 96.38 minutes across 39 recorded finals. This suggests that championship matches at the Canadian Open often feature one dominant player asserting control, while the quarterfinal and Round of 16 stages — where the draw’s strongest contenders first collide — produce the most competitive, extended battles.
Round of 32 matches average 97.88 minutes (623 matches), and Round of 64 matches come in at 96.24 minutes (998 matches). Even in the earliest rounds, matches push past the 90-minute mark, reinforcing the tournament’s identity as a grinder’s event where quick wins are relatively rare.
Median match length: 93 minutes
Longest match: Sara Sorribes Tormo d. Claire Liu 7-6(4) 2-6 7-6(5) (213 min, R64 2022)
What to Expect in 2026
With the expanded 96-player draw now in its second year, the 2025 edition already showed a surge in match volume (374 matches, the most in any single year in TennisMattch.com’s database). That expansion means more R64 and R32 matches, which average 96–98 minutes apiece. Fans attending the Canadian Open 2026 should plan for long days — especially during the opening week, when the sheer volume of competitive, closely matched encounters can stretch sessions well into the evening.
Year-by-Year Trends
The Canadian Open’s statistical profile has shifted meaningfully over the past decade and a half. According to TennisMattch.com’s annual trends data, the tournament has seen notable changes in serve quality, break-point dynamics, and match volume — trends that frame what to expect from the 2026 edition.
The Ace Surge
Aces have trended upward. In 2008, the tournament averaged just 4.04 aces per match. By 2023, that figure had risen to 4.84, and in 2025 it reached 5.32 — a 32% increase over the 2008 baseline. Several factors likely contribute: advances in racket technology, a generation of players who grew up training with high-speed video analysis, and the expanded draw introducing more big-serving men and women into the main draw. Still, even at 5.32, the 2025 ace average barely exceeds the tour-wide norm of 5.00, confirming that the Canadian Open remains inhospitable to pure servers.
Double Faults: A Rising Concern
The flip side of bigger serving is more risk — and more errors. Double faults have climbed sharply, from 3.31 per match in 2008 to 4.63 in 2025 — a 40% increase. That 2025 figure is especially notable, dwarfing the tournament’s all-time average of 3.84. The combination of aggressive serving and challenging outdoor conditions appears to be creating a higher-variance serve game, where players are trading more free points (aces) for more unforced errors (double faults).
First-Serve Percentage: Declining Accuracy
First-serve accuracy has declined over our sample. In 2010, players landed 61.89% of first serves — above the tour average. By 2024, that figure had dropped to 57.75%, the lowest in our dataset. The 2023 edition posted 59.47%. This downward trend correlates with the rise in aces and double faults: as players swing harder on first serve, they naturally find the box less often. Whether this trend continues into 2026 depends partly on the draw composition and partly on how conditions play during the August schedule.
Break-Point Conversion: Volatile but Stable
Break-point conversion rates have bounced around but show no clear long-term trend. The range spans from 42.07% (2023) to 45.70% (2024), with the all-time average sitting at 44.27%. The 2025 edition came in at 43.23%, suggesting a slight regression from 2024’s returner-friendly environment. For 2026, the expectation should be conversion rates in the 43–45% range — enough to create constant pressure on servers but not so high as to eliminate the advantage of holding serve entirely.
Match Volume Explosion
The expanded draw format has dramatically increased the number of matches played. In 2008, the tournament produced 216 matches. By 2025, that number had nearly doubled to 374. The 2024 edition — which may have been a transition year — featured 218 matches, but the full expansion was evident in 2025. This increased match volume means more content for fans, more ranking points in play, and more opportunities for lower-ranked players to make a mark.
| Year | Matches | Avg Aces | Avg DFs | 1st Serve % | BP Conv % |
|---|---|---|---|---|---|
| 2025 | 374 | 5.3 | 4.6 | — | 43.2% |
| 2024 | 218 | 4.1 | 4.1 | 57.8% | 45.7% |
| 2023 | 214 | 4.8 | 3.9 | 59.5% | 42.1% |
| 2022 | 220 | 4.6 | 3.9 | 62.3% | 43.9% |
| 2021 | 188 | 5.7 | 4.0 | 58.9% | 43.7% |
| 2019 | 218 | 4.9 | 3.9 | 60.9% | 43.8% |
| 2018 | 218 | 4.9 | 4.0 | 59.4% | 45.9% |
| 2017 | 220 | 4.4 | 3.9 | 59.2% | 48.9% |
| 2016 | 220 | 4.9 | 3.8 | 59.3% | 43.9% |
| 2015 | 218 | 4.7 | 3.6 | 63.2% | 44.2% |
| 2014 | 214 | 5.2 | 3.9 | 59.3% | 43.0% |
| 2013 | 212 | 3.9 | 4.4 | 59.1% | 44.3% |
| 2012 | 184 | 4.1 | 3.4 | 59.9% | 44.2% |
| 2011 | 208 | 4.1 | 3.4 | 58.8% | 43.9% |
| 2010 | 198 | 4.3 | 3.2 | 61.9% | 42.4% |
| 2009 | 216 | 4.2 | 3.3 | 61.8% | 45.4% |
| 2008 | 216 | 4.0 | 3.3 | 60.6% | 44.8% |
King of the Canadian Open
Ivan Lendl is the undisputed king of the Canadian Open, holding the all-time record with 7 titles — more than any other player in the tournament’s 140-plus-year history. His reign stretched across a remarkable decade: 1980, 1981, 1983, 1987, 1988, 1989, and 1990. According to TennisMattch.com’s database, Lendl compiled a 62–9 win-loss record at this event — an 87.3% winning percentage that towers over every other multi-time champion in the tournament’s records.
A Perfect Match of Player and Tournament
Lendl’s dominance at the Canadian Open was no accident. The tournament’s conditions — a medium-paced hard court that rewards baseline consistency over raw serve power — aligned perfectly with his game. Lendl was not the flashiest player of his era, but he was arguably the most relentless. His topspin forehand, metronomic backhand, and unshakable fitness made him a nightmare on surfaces that slowed the ball just enough to neutralize bigger servers. In an era defined by serve-and-volley, Lendl imposed a baseliner’s blueprint at this tournament and won more titles than anyone thought possible.
His seven titles came in two clusters: a back-to-back run in 1980–81, followed by a stunning four consecutive crowns from 1987 through 1990. That second streak is particularly extraordinary — winning any Masters-level event four years running requires not just talent but obsessive preparation and physical durability. During the 1987–1990 stretch, Lendl was in his late twenties and early thirties, an age when most players begin to decline. Instead, he used the Canadian Open as a launchpad for his late-career US Open runs, treating it as the ultimate hard-court proving ground.
How Others Compare
The next-closest contender on the men’s side is Rafael Nadal, who won 5 titles with a 39–8 record (83.0% winning percentage). Nadal’s first-serve percentage at this tournament averaged 65.01% — well above the tournament average of 60.12% — while averaging 3.19 aces per match. Nadal’s success underscores a similar theme to Lendl’s: the Canadian Open favors players who can grind opponents down from the baseline, even on hard courts.
Novak Djokovic claimed 4 titles with a 37–7 record (84.1% winning percentage), averaging 4.69 aces and a 64.93% first-serve rate. Chris Evert matched Djokovic with 4 titles and posted a 34–5 record (87.2% winning percentage) — virtually identical to Lendl’s efficiency. Monica Seles also won 4 titles with the tournament’s most extreme win-loss ratio among top players: 31–3, a 91.2% winning percentage.
On the current tour, Simona Halep (3 titles), Andy Murray (3 titles), and Serena Williams (3 titles, 35–7 record) all left significant marks. Among active players, Jessica Pegula has emerged as a Canadian Open specialist with 2 titles, while Ben Shelton has already claimed 2 title — a sign that the next generation is ready to stake its claim.
| Player | Record | Titles | Avg Aces |
|---|---|---|---|
| Ivan Lendl | 62W-9L | 7 | — |
| John McEnroe | 47W-15L | 2 | — |
| Rafael Nadal | 39W-8L | 5 | 3.2 |
| Andre Agassi | 38W-11L | 3 | — |
| Novak Djokovic (Serbia) | 37W-7L | 4 | 4.7 |
| Serena Williams | 35W-7L | 3 | 7.9 |
| Roger Federer | 35W-10L | 2 | 7.5 |
| Chris Evert | 34W-5L | 4 | — |
| Arantxa Sanchez Vicario | 32W-10L | 2 | — |
| Monica Seles | 31W-3L | 4 | — |
| Martina Navratilova | 30W-5L | 4 | — |
| Tom Okker | 30W-7L | 2 | — |
| Kevin Curren | 29W-12L | 1 | — |
| Andy Murray | 29W-9L | 3 | 5.6 |
| Jennifer Capriati | 28W-9L | 1 | — |
Greatest Upsets
The Canadian Open has a rich history of upsets, fueled by conditions that level the playing field between servers and returners. With aces averaging just 4.63 per match — below the tour-wide 5.00 — and double faults running at 3.84 (above the tour’s 3.35), the serve provides less of a safety net than at other hard-court events. That creates openings for lower-ranked players with strong return games and the stamina to grind through long rallies.
The Conditions for Upsets
Several structural factors make the Canadian Open fertile ground for surprises. The outdoor setting introduces weather variability — wind, humidity, and occasional rain delays can disrupt rhythm and momentum. The 96-player draw means top seeds now face more matches to reach the final, increasing the opportunities for fatigue-induced upsets in the later rounds. And the tournament’s placement in the August calendar, sandwiched between the grass-court season and the US Open, means top players are often managing workload and may not be at peak sharpness.
The break-point conversion data supports this narrative. At 44.27%, the tournament’s conversion rate is right at the tour average — but the frequency of break-point opportunities is elevated thanks to lower first-serve percentages (60.12% vs. 61.13% tour-wide). More chances to break mean more chances for the underdog to steal a set, and in a best-of-three format, one stolen set is halfway to a shock result.
The Marathon Factor
Match duration data adds another dimension to the upset calculus. The average match runs 98 minutes, with quarterfinals averaging 102.18 minutes — the longest of any round. For top seeds who may have battled through earlier rounds, these extended quarterfinal encounters create vulnerability. A fresh, fiery underdog facing a fatigued favorite in a 100-plus-minute battle has a real chance of pulling off the unexpected.
Consider the tournament’s longest match: Sara Sorribes Tormo’s 213-minute R64 victory over Claire Liu on August 8, 2022. That match — 7-6(4), 2-6, 7-6(5) — exemplifies the Canadian Open’s capacity for drama. Neither player was a household name, but the match became an endurance test that would have drained either player heading into the next round. When upsets happen at this tournament, they often emerge from exactly this kind of grinding, attritional encounter.
The Data Behind the Drama
The most instructive upset indicator may be the second-serve win percentage. At 48.27%, it hovers dangerously close to a coin flip. For top seeds, a bad serving day can be catastrophic. If a player’s second serve drops below that 48% threshold — due to nerves, fatigue, or a particularly aggressive returner — breaks of serve cascade quickly in a best-of-three format. The Canadian Open’s conditions make that threshold easier to breach than at most hard-court tournaments, which is why the event continues to produce shocks year after year.
Rivalries
The Canadian Open has served as a stage for some of tennis’s most celebrated rivalries, with the tournament’s unique conditions — suppressed serve numbers, extended rallies, and demanding outdoor heat — often producing pivotal chapters in the sport’s greatest head-to-head battles.
Lendl vs. McEnroe: The Defining Rivalry
The tournament’s statistical record is dominated by two names at the top of the all-time leaderboard: Ivan Lendl (62–9, 7 titles) and John McEnroe (47–15, 2 titles). Their rivalry defined the Canadian Open in the 1980s, pitting Lendl’s relentless baseline power against McEnroe’s artistry at the net. Between them, they accumulated 133 combined appearances (matches played) at this tournament — a staggering figure that speaks to their longevity and competitiveness. Lendl’s seven titles ultimately dwarfed McEnroe’s two, but their encounters at this event were among the most anticipated matches on the summer hard-court calendar. The conditions clearly favored Lendl’s style, but McEnroe’s serve-and-volley game was just dangerous enough to make every meeting unpredictable.
Nadal vs. Djokovic: The Modern Clash
In the 21st century, the Canadian Open’s marquee rivalry has been Rafael Nadal vs. Novak Djokovic. Their combined numbers at this tournament are extraordinary: Nadal with 5 titles and a 39–8 record; Djokovic with 4 titles and 37–7. Both players posted first-serve percentages well above the tournament average — Nadal at 65.01%, Djokovic at 64.93% — suggesting they brought an elite level of serving precision that most players cannot sustain in these conditions. Their meetings on Canadian hard courts represented a clash of two players who had each decoded the tournament’s demands: consistency, physicality, and the ability to thrive in break-point pressure cookers.
Evert vs. Seles: The Women’s Benchmark
On the women’s side, the statistical comparison between Chris Evert and Monica Seles is remarkable. Evert posted a 34–5 record with 4 titles; Seles went 31–3 with 4 titles. Their careers overlapped only slightly, so they weren’t direct rivals at this event in the traditional sense, but their statistical profiles set the benchmark against which all future women’s champions are measured. Seles’s 91.2% winning percentage remains the gold standard for players with significant match volume at the Canadian Open.
Williams vs. The Field
Serena Williams’s 3 titles and 35–7 record (83.3% winning percentage) made her the most formidable force in the women’s draw for over a decade. Her average of 7.90 aces per match — nearly double the tournament average of 4.63 — underscores just how much her serve separated her from the competition. Williams didn’t just win at the Canadian Open; she overwhelmed opponents with a weapon that most players at this tournament couldn’t replicate. Roger Federer, interestingly, occupied a similar statistical niche on the men’s side: 2 titles, 35–10 record, and 7.48 aces per match — again, well above the tournament average. Both players brought serve-dominant games to a tournament that typically favors returners, and their ability to succeed anyway speaks to their all-around brilliance.
The Next Chapter
With Jessica Pegula (2 titles) and Ben Shelton (2 title) already established as Canadian Open contenders, the 2026 edition could see the beginning of new rivalries. Pegula’s return-oriented game is tailor-made for these conditions, while Shelton’s explosive athleticism and improving consistency make him a future multi-title threat. Whether they clash with each other’s generational peers or challenge the established order, the Canadian Open’s stage is set for compelling new chapters.
Prize Money & Points
The Canadian Open 2026 offers a combined prize purse of $14.34 million (USD), making it one of the richest tournaments outside the four Grand Slams. The ATP champion takes home $1,124,380, while the WTA winner receives $752,275. That differential is notable — but it’s shrinking by design.
The Path to Parity
Under the “Game. Set. Equity.” initiative, a partnership between Tennis Canada and title sponsor National Bank, the tournament is progressively increasing WTA prize money with the goal of achieving full parity with the ATP by 2027. The 2026 edition represents the penultimate step in that journey. When parity is achieved, the National Bank Open will join only a handful of events worldwide — the Grand Slams and a few others — that offer equal prize money regardless of gender. For a tournament operated by a not-for-profit organization that reinvests proceeds into grassroots development, this commitment carries particular resonance.
How It Compares
The $14.34 million combined purse places the Canadian Open among the top tier of Masters 1000/WTA 1000 events. The winner’s check of $1,124,380 on the ATP side is competitive with other Masters 1000 events like the Miami Open and Indian Wells, though still well below Grand Slam payouts. On the WTA side, the $752,275 winner’s prize is among the highest for any WTA 1000 event.
Investment in Canadian Tennis
What distinguishes the Canadian Open’s prize money structure is where the remaining revenue goes. Tennis Canada, as a not-for-profit, channels net tournament proceeds into player development, coaching education, and court construction across the country. Every ticket sold, every sponsorship dollar earned, and every broadcast deal signed ultimately funds the next generation of Canadian tennis talent. The prize money paid to players is just one piece of a broader financial ecosystem designed to sustain the sport at every level — from the centre court at IGA Stadium to community courts in rural provinces.
Weather & Conditions
Weather is a critical variable at the Canadian Open, and the data reveals a stark contrast between what forecasting models might predict for the tournament dates and what historical conditions actually deliver.
What the Climate Data Says
Based on TennisMattch.com’s five-year historical climate data for the tournament period, players and fans should expect warm, humid summer conditions. The average daily high is 26.6°C (79.9°F), with lows around 17.9°C (64.2°F). Average daily precipitation is 7.3 mm, and wind speeds average 16.5 km/h. These are comfortable conditions for outdoor tennis — warm enough to keep muscles loose but not so extreme as to cause heat-related issues for most players.
The Humidity Factor
What the raw temperature numbers don’t fully capture is the humidity. Both Montreal and Toronto experience significant summer humidity, which affects ball flight, court speed, and player endurance. Humid conditions cause the ball to move more slowly through the air, effectively slowing the court pace and giving returners a fraction of a second longer to react. This aligns with the tournament’s serve data: the below-average ace rate (4.63 per match) and above-average double-fault rate (3.84) are partly attributable to conditions that make it harder to hit clean, unreturnable serves.
Rain Delays and Scheduling
With an average daily precipitation of 7.3 mm and precipitation probability that can reach meaningful levels during August, rain delays are a recurring factor at the Canadian Open. Neither IGA Stadium nor Sobeys Stadium currently has a retractable roof, making the tournament vulnerable to weather interruptions. The expanded 12-day schedule helps absorb these delays, but fans should always have a contingency plan for sessions that may be postponed or compressed due to rain.
The Wind Variable
Average wind speeds of 16.5 km/h are moderate but non-trivial for outdoor hard-court tennis. Wind affects toss placement, ball trajectory on serve, and the ability to hit clean winners from the baseline. For players who rely on precision — drop shots, angled volleys, slice backhands — wind can be a disruptive force. For grinders who keep the ball deep and wait for errors, wind is an ally. Once again, the conditions at the Canadian Open favor a certain style of play, and the weather is a significant contributor to that bias.
What to Wear and Bring
For fans attending the Canadian Open 2026, dress for summer warmth but prepare for variability. A light rain jacket or poncho is essential. Sunscreen and hats are mandatory for day sessions — extended exposure in 27°C heat with high humidity can be draining even for spectators. Evening sessions cool to the high teens (Celsius), making a light layer advisable. Hydration is key, both for players on court and fans in the stands.
Records & Fun Facts
Every great tournament has its quirks, records, and pieces of trivia that bring the event to life beyond the scorelines. The Canadian Open — with more than 140 years of history and 3,756 matches in TennisMattch.com’s database — has no shortage of fascinating footnotes.
Ivan Lendl: The Undisputed King of Canada
No discussion of Canadian Open records can begin anywhere other than with Ivan Lendl, the tournament’s all-time king. Lendl captured a staggering 7 titles at the Canadian Open — more than any other player in the event’s history — and amassed 62 match wins, also a tournament record. His dominance throughout the 1980s and early 1990s was so thorough that he turned the Canadian Open into something of a personal fiefdom, routinely dispatching the best players in the world on Canadian hard courts. Lendl’s combination of relentless baseline power, supreme fitness, and tactical precision made him virtually unbeatable at this event. Among the 50 champions recorded in TennisMattch.com’s database, no one comes close to matching his haul. John McEnroe, with 47 wins, and Rafael Nadal, with 39 wins, are the next most prolific performers — but neither could challenge Lendl’s reign at the top. His record stands as one of the most dominant single-tournament achievements in the history of professional tennis.
The Third-Oldest Tournament in the World
Founded in 1881, the Canadian Open predates the French Open (1891), the Davis Cup (1900), and every other ATP or WTA event except Wimbledon (1877) and the US Open (1881, same year). When the first Canadian Championships were held, tennis was still a lawn sport played by Victorian elites. The tournament has survived two world wars, the amateur-professional split, and multiple name changes to become the $14.34 million spectacle it is today.
The Two-City Split
No other major tennis tournament splits its men’s and women’s events between two cities annually. The Montreal-Toronto alternation gives the Canadian Open a dual identity — the energy of Montreal’s French-Canadian culture one year, the cosmopolitan buzz of Canada’s largest city the next. It also means the tournament effectively has two home crowds, two venue personalities, and two sets of loyal fans who wait every other year for their preferred event to return.
Recycled Tennis Balls in the Court Surface
In 2023, the centre court at Sobeys Stadium was resurfaced using an eco-friendly acrylic mix that incorporated 1,400 recycled tennis balls from the previous year’s tournament. The balls were ground into a rubber compound and blended into the court surface layers — a first-of-its-kind sustainability initiative in professional tennis.
Aces That Build Courts
Official court surface partner Har-Tru donates $15 to the Play Your Court program for every ace hit during the tournament. Given the tournament’s average of 4.63 aces per match and the 374 matches played in 2025, that translates to roughly $26,000 per year in community court funding generated purely by aces. It’s a clever tie-in that gives every big serve a philanthropic dimension.
Monica Seles’s Untouchable Winning Percentage
Among players with at least 30 matches at the Canadian Open, Monica Seles’s 31–3 record (91.2% winning percentage) is the highest in tournament history. She won 4 titles while losing barely a handful of matches — a level of dominance that even Ivan Lendl (87.3%) and Chris Evert (87.2%) couldn’t quite match.
Serena’s Serve Superiority
Serena Williams averaged 7.90 aces per match at the Canadian Open — 70% above the tournament average of 4.63. Among all players with significant match volume, no one came close to matching her serve output at this event. Roger Federer was the nearest comparable at 7.48, but even he trailed Williams in raw ace production.
The 14-Minute Match
The shortest match in the tournament’s database lasted just 14 minutes — a near-certain retirement scenario. Compare that to the longest at 213 minutes (Sorribes Tormo vs. Liu in 2022), and you have a 199-minute gap between the extremes. That’s the Canadian Open: a tournament where anything can happen, from a walkover to a war.
Record Attendance in 2025
The 2025 edition set an all-time attendance record with 504,860 combined spectators across both venues — 287,329 in Montreal and 217,531 in Toronto. That figure reflects the expanded draw, the 12-day format, and the growing appetite for live professional tennis in Canada. The 2026 edition will look to build on that foundation.
Winners’ Average: 20.95 Winners Per Match
Players average 20.95 winners per match at the Canadian Open, according to TennisMattch.com’s database. With an average of 72.54 total points won per match, that means roughly 29% of all points won are clean winners — the rest coming from errors, forced and unforced. It’s a tournament that rewards shot-making, but one where patience and consistency ultimately tip the balance.
Past Champions
| Year | Champion | Runner-Up | Score |
|---|---|---|---|
| 2025 | Ben Shelton (USA) | Karen Khachanov | 1 – 2 |
| 2024 | Alexei Popyrin (Australia) | Andrey Rublev | 6-2 6-4 |
| 2023 | Jannik Sinner (Italy) | Alex De Minaur | 6-4 6-1 |
| 2022 | Pablo Carreno-Busta | Hubert Hurkacz | 3-6 6-3 6-3 |
| 2021 | Daniil Medvedev (RUS) | Reilly Opelka | 6-4 6-3 |
| 2019 | Rafael Nadal | Daniil Medvedev | 6-3 6-0 |
| 2018 | Rafael Nadal | Stefanos Tsitsipas | 6-2 7-6(4) |
| 2017 | Alexander Zverev (Germany) | Roger Federer | 6-3 6-4 |
| 2016 | Novak Djokovic (Serbia) | Kei Nishikori | 6-3 7-5 |
| 2015 | Andy Murray | Novak Djokovic | 6-4 4-6 6-3 |
| 2014 | Jo-Wilfried Tsonga | Roger Federer | 7-5 7-6(3) |
| 2013 | Rafael Nadal | Milos Raonic | 6-2 6-2 |
| 2012 | Novak Djokovic (Serbia) | Richard Gasquet | 6-3 6-2 |
| 2011 | Novak Djokovic (Serbia) | Mardy Fish | 6-2 3-6 6-4 |
| 2010 | Andy Murray | Roger Federer | 7-5 7-5 |
| 2009 | Andy Murray | Juan Martin del Potro | 6-7(4) 7-6(3) 6-1 |
| 2008 | Rafael Nadal | Nicolas Kiefer | 6-3 6-2 |
| 2007 | Novak Djokovic (Serbia) | Roger Federer | 7-6(2) 2-6 7-6(2) |
| 2006 | Roger Federer | Richard Gasquet | 2-6 6-3 6-2 |
| 2005 | Rafael Nadal | Andre Agassi | 6-3 4-6 6-2 |
| 2004 | Roger Federer | Andy Roddick | 7-5 6-3 |
| 2003 | Andy Roddick | David Nalbandian | 6-1 6-3 |
| 2002 | Guillermo Canas | Andy Roddick | 6-4 7-5 |
| 2001 | Andrei Pavel | Patrick Rafter | 7-6(3) 2-6 6-3 |
| 2000 | Marat Safin | Harel Levy | 6-2 6-3 |
| Year | Champion | Runner-Up | Score |
|---|---|---|---|
| 2025 | Victoria Mboko (Canada) | Naomi Osaka | 2 – 1 |
| 2024 | Jessica Pegula (USA) | Amanda Anisimova | 6-3 2-6 6-1 |
| 2023 | Jessica Pegula (USA) | Liudmila Samsonova | 6-1 6-0 |
| 2022 | Simona Halep | Beatriz Haddad Maia | 6-3 2-6 6-3 |
| 2021 | Camila Giorgi | Karolina Pliskova | 6-3 7-5 |
| 2019 | Bianca Andreescu | Serena Williams | 3-1 RET |
| 2018 | Simona Halep | Sloane Stephens | 7-6(6) 3-6 6-4 |
| 2017 | Elina Svitolina (Ukraine) | Caroline Wozniacki | 6-4 6-0 |
| 2016 | Simona Halep | Madison Keys | 7-6(2) 6-3 |
| 2015 | Belinda Bencic (Switzerland) | Simona Halep | 7-6(5) 6-7(4) 3-0 RET |
| 2014 | Agnieszka Radwanska | Venus Williams | 6-4 6-2 |
| 2013 | Serena Williams | Sorana Cirstea | 6-2 6-0 |
| 2012 | Petra Kvitova | Na Li | 7-5 2-6 6-3 |
| 2011 | Serena Williams | Samantha Stosur | 6-4 6-2 |
| 2010 | Caroline Wozniacki | Vera Zvonareva | 6-3 6-2 |
| 2009 | Elena Dementieva | Maria Sharapova | 6-4 6-3 |
| 2008 | Dinara Safina | Dominika Cibulkova | 6-2 6-1 |
| 2007 | Justine Henin | Jelena Jankovic | 7-6(3) 7-5 |
| 2006 | Ana Ivanovic | Martina Hingis | 6-2 6-3 |
| 2005 | Kim Clijsters | Justine Henin | 7-5 6-1 |
| 2004 | Amelie Mauresmo | Elena Likhovtseva | 6-1 6-0 |
| 2003 | Justine Henin | Lina Krasnoroutskaya | 6-1 6-0 |
| 2002 | Amelie Mauresmo | Jennifer Capriati | 6-4 6-1 |
| 2001 | Serena Williams | Jennifer Capriati | 6-1 6-7(7) 6-3 |
| 2000 | Martina Hingis | Serena Williams | 0-6 6-3 3-0 RET |
Year-by-Year Statistics
| Year | Matches | Avg Aces | Avg DFs | 1st Serve % | BP Conv % |
|---|---|---|---|---|---|
| 2025 | 374 | 5.3 | 4.6 | — | 43.2% |
| 2024 | 218 | 4.1 | 4.1 | 57.8% | 45.7% |
| 2023 | 214 | 4.8 | 3.9 | 59.5% | 42.1% |
| 2022 | 220 | 4.6 | 3.9 | 62.3% | 43.9% |
| 2021 | 188 | 5.7 | 4.0 | 58.9% | 43.7% |
| 2019 | 218 | 4.9 | 3.9 | 60.9% | 43.8% |
| 2018 | 218 | 4.9 | 4.0 | 59.4% | 45.9% |
| 2017 | 220 | 4.4 | 3.9 | 59.2% | 48.9% |
| 2016 | 220 | 4.9 | 3.8 | 59.3% | 43.9% |
| 2015 | 218 | 4.7 | 3.6 | 63.2% | 44.2% |
| 2014 | 214 | 5.2 | 3.9 | 59.3% | 43.0% |
| 2013 | 212 | 3.9 | 4.4 | 59.1% | 44.3% |
| 2012 | 184 | 4.1 | 3.4 | 59.9% | 44.2% |
| 2011 | 208 | 4.1 | 3.4 | 58.8% | 43.9% |
| 2010 | 198 | 4.3 | 3.2 | 61.9% | 42.4% |
| 2009 | 216 | 4.2 | 3.3 | 61.8% | 45.4% |
| 2008 | 216 | 4.0 | 3.3 | 60.6% | 44.8% |
All-Time Player Records
| Player | Record | Titles | Avg Aces |
|---|---|---|---|
| Ivan Lendl | 62W-9L | 7 | — |
| John McEnroe | 47W-15L | 2 | — |
| Rafael Nadal | 39W-8L | 5 | 3.2 |
| Andre Agassi | 38W-11L | 3 | — |
| Novak Djokovic (Serbia) | 37W-7L | 4 | 4.7 |
| Serena Williams | 35W-7L | 3 | 7.9 |
| Roger Federer | 35W-10L | 2 | 7.5 |
| Chris Evert | 34W-5L | 4 | — |
| Arantxa Sanchez Vicario | 32W-10L | 2 | — |
| Monica Seles | 31W-3L | 4 | — |
| Martina Navratilova | 30W-5L | 4 | — |
| Tom Okker | 30W-7L | 2 | — |
| Kevin Curren | 29W-12L | 1 | — |
| Andy Murray | 29W-9L | 3 | 5.6 |
| Jennifer Capriati | 28W-9L | 1 | — |