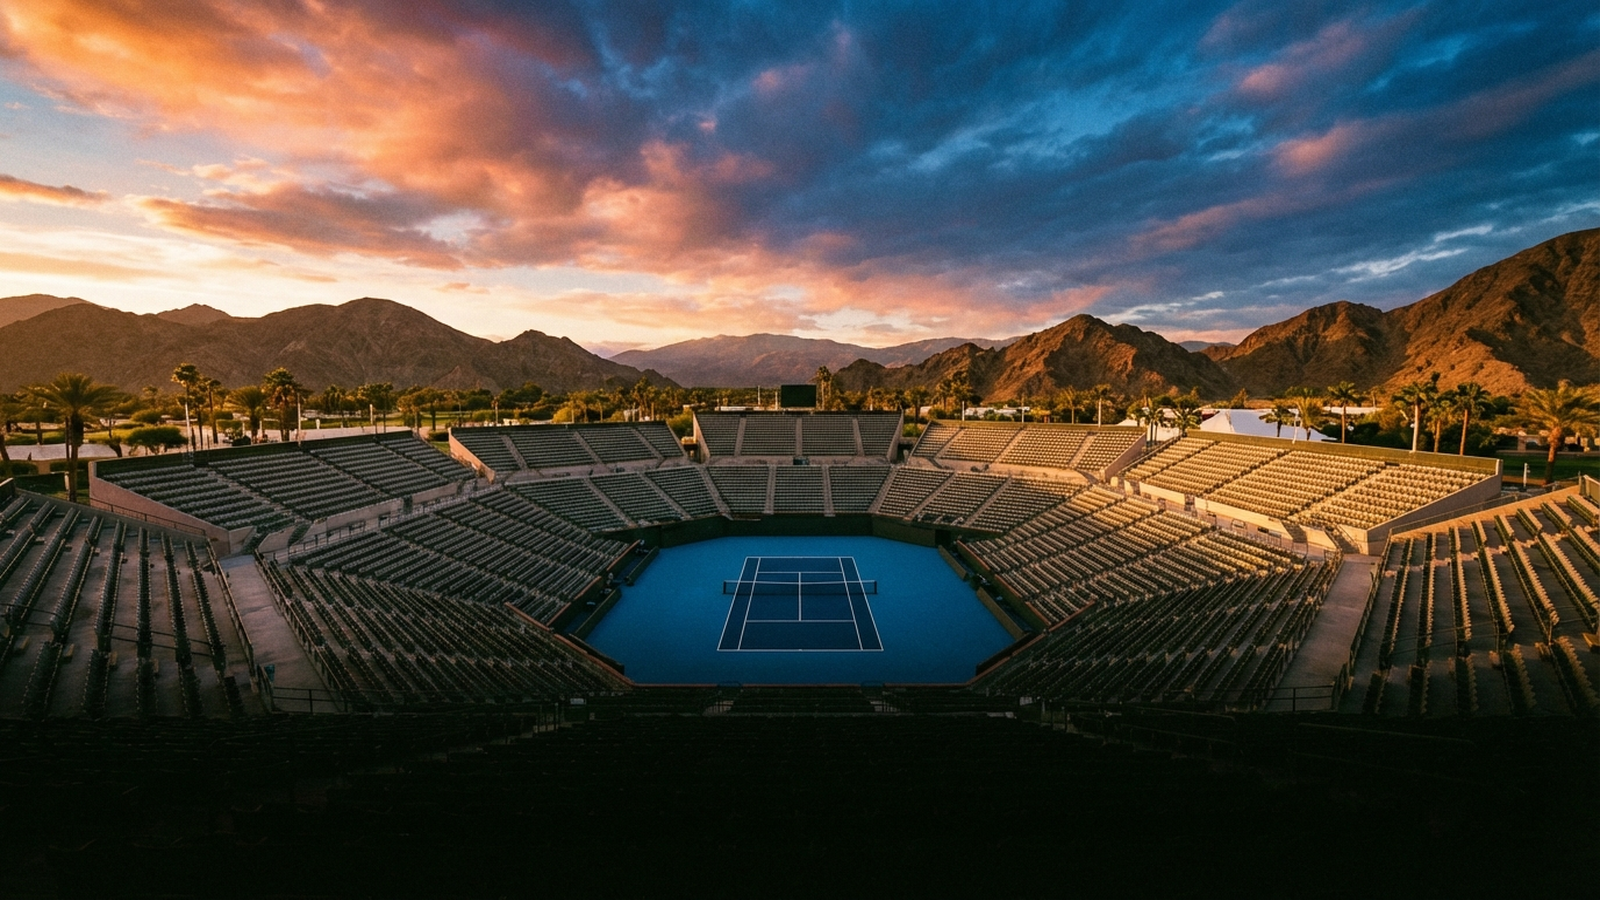
The BNP Paribas Open 2026 returns to the Indian Wells Tennis Garden from March 4–15, 2026, bringing the world’s best men’s and women’s players to the Coachella Valley for what the tennis community has long called the “Fifth Grand Slam.” With a record-setting 504,268 fans passing through the gates in 2025 — surpassing the previous mark of 493,440 set just one year before — the tournament’s cultural and competitive footprint continues to expand at a pace unmatched by any event outside the four majors.
According to TennisMattch.com’s database of 5,622 matches played at this event, the BNP Paribas Open is a tournament defined by baseline depth, strategic serving, and relentless break-point battles rather than pure power. The average match produces just 3.77 aces — well below the tour-wide average of 5.00 — while break-point conversion sits at 44.98%, slightly above the tour average of 44.33%. These numbers paint a picture of a tournament where rallies matter more than free points, and where mental toughness under pressure separates champions from contenders.
This guide covers everything you need to know ahead of the 2026 edition: the tournament’s storied history from Tucson to Indian Wells, in-depth statistical analysis of serve patterns, break-point dynamics, and match-duration trends, a profile of the tournament’s all-time king Novak Djokovic (tied with Roger Federer at 5 titles apiece), the greatest upsets in event history, prize money breakdowns, weather conditions, and practical information for fans planning to attend. Whether you’re booking flights or building your bracket, consider this your definitive resource.
Tournament History
The BNP Paribas Open traces its roots to 1974, when it debuted as a modest event in Tucson, Arizona. For its first decade-plus, the tournament shuffled between venues — briefly calling Rancho Mirage and La Quinta home — before finding its permanent address in Indian Wells, California, in 1987. That relocation proved transformative. The desert setting offered space, climate, and ambition that smaller facilities could never match, and the tournament quickly began its ascent through the professional tennis hierarchy.
A pivotal moment came in 1996, when the event became one of the few fully combined tournaments on both the ATP and WTA tours. For the first time, fans could watch the world’s best men and women compete simultaneously across a multi-week format — a structure that remains one of the tournament’s defining selling points. The combined format also supercharged the event’s database: TennisMattch.com’s records encompass 5,622 total matches, a massive sample that includes both tours and provides uniquely rich statistical insights.
The year 2000 marked the next leap forward with the opening of the Indian Wells Tennis Garden, a purpose-built facility anchored by a 16,100-seat Stadium 1 — the second-largest tennis-specific stadium in the world. But the tournament’s transformation into a global mega-event truly accelerated in 2009, when Oracle co-founder and billionaire Larry Ellison purchased the tournament and its venue. Ellison’s investment was immediate and sweeping: he added an 8,000-seat Stadium 2, upgraded every corner of the fan experience, and made Indian Wells the first tournament in the world to deploy Hawk-Eye electronic line calling on every single match court — a technological leap that the rest of professional tennis would take years to follow.
Today, the BNP Paribas Open holds both ATP Masters 1000 and WTA 1000 designations, placing it at the highest tier of non-Grand Slam tennis. As the opening leg of the elite spring hard-court swing, it forms the first half of the coveted “Sunshine Double” alongside the Miami Open. Players who conquer both Indian Wells and Miami in the same year achieve one of the tour’s most prized feats — a testament to the grueling physical and tactical demands of consecutive two-week events on hard courts.
The championship roll call reflects the tournament’s stature. Roger Federer and Novak Djokovic share the men’s record with 5 titles each, while Rafael Nadal claimed 3 titles. On the women’s side, multiple champions include Maria Sharapova (2 titles), Iga Swiatek (2 titles), Kim Clijsters (2 titles), Daniela Hantuchova (2 titles), and Serena Williams (2 titles). The full list of past champions tells a story of the sport’s greatest players rising to the occasion on one of its grandest stages.
| Year | Champion | Runner-Up | Score |
|---|---|---|---|
| 2025 | Jack Draper (United Kingdom) | Holger Rune | 0 – 2 |
| 2024 | Carlos Alcaraz (Spain) | Daniil Medvedev | 7-6(5) 6-1 |
| 2023 | Carlos Alcaraz (Spain) | Daniil Medvedev | 6-3 6-2 |
| 2022 | Taylor Fritz (USA) | Rafael Nadal | 6-3 7-6(5) |
| 2021 | Cameron Norrie (United Kingdom) | Nikoloz Basilashvili | 3-6 6-4 6-1 |
| 2019 | Dominic Thiem | Roger Federer | 3-6 6-3 7-5 |
| 2018 | Juan Martin del Potro | Roger Federer | 6-4 6-7(8) 7-6(2) |
| 2017 | Roger Federer | Stan Wawrinka | 6-4 7-5 |
| 2016 | Novak Djokovic (Serbia) | Milos Raonic | 6-2 6-0 |
| 2015 | Novak Djokovic (Serbia) | Roger Federer | 6-3 6-7(5) 6-2 |
| 2014 | Novak Djokovic (Serbia) | Roger Federer | 3-6 6-3 7-6(3) |
| 2013 | Rafael Nadal | Juan Martin del Potro | 4-6 6-3 6-4 |
| 2012 | Roger Federer | John Isner | 7-6(7) 6-3 |
| 2011 | Novak Djokovic (Serbia) | Rafael Nadal | 4-6 6-3 6-2 |
| 2010 | Ivan Ljubicic | Andy Roddick | 7-6(3) 7-6(5) |
| 2009 | Rafael Nadal | Andy Murray | 6-1 6-2 |
| 2008 | Novak Djokovic (Serbia) | Mardy Fish | 6-2 5-7 6-3 |
| 2007 | Rafael Nadal | Novak Djokovic | 6-2 7-5 |
| 2006 | Roger Federer | James Blake | 7-5 6-3 6-0 |
| 2005 | Roger Federer | Lleyton Hewitt | 6-2 6-4 6-4 |
| 2004 | Roger Federer | Tim Henman | 6-3 6-3 |
| 2003 | Lleyton Hewitt | Gustavo Kuerten | 6-1 6-1 |
| 2002 | Lleyton Hewitt | Tim Henman | 6-1 6-2 |
| 2001 | Andre Agassi | Pete Sampras | 7-6(5) 7-5 6-1 |
| 2000 | Alex Corretja | Thomas Enqvist | 6-4 6-4 6-3 |
| 1999 | Mark Philippoussis | Carlos Moya | 5-7 6-4 6-4 4-6 6-2 |
| 1998 | Marcelo Rios | Greg Rusedski | 6-3 6-7(15) 7-6(4) 6-4 |
| Year | Champion | Runner-Up | Score |
|---|---|---|---|
| 2025 | Mirra Andreeva (RUS) | Aryna Sabalenka | 1 – 2 |
| 2024 | Iga Swiatek (Poland) | Maria Sakkari | 6-4 6-0 |
| 2023 | Elena Rybakina (Kazakhstan) | Aryna Sabalenka | 7-6(11) 6-4 |
| 2022 | Iga Swiatek (Poland) | Maria Sakkari | 6-4 6-1 |
| 2021 | Paula Badosa (Spain) | Victoria Azarenka | 7-6(5) 2-6 7-6(2) |
| 2015 | Simona Halep | Jelena Jankovic | 2-6 7-5 6-4 |
| 2014 | Flavia Pennetta | Agnieszka Radwanska | 6-2 6-1 |
| 2013 | Maria Sharapova | Caroline Wozniacki | 6-2 6-2 |
| 2012 | Victoria Azarenka (BLR) | Maria Sharapova | 6-2 6-3 |
| 2011 | Caroline Wozniacki | Marion Bartoli | 6-1 2-6 6-3 |
| 2010 | Jelena Jankovic | Caroline Wozniacki | 6-2 6-4 |
| 2009 | Vera Zvonareva | Ana Ivanovic | 7-6(5) 6-2 |
| 2008 | Ana Ivanovic | Svetlana Kuznetsova | 6-4 6-3 |
| 2007 | Daniela Hantuchova | Svetlana Kuznetsova | 6-3 6-4 |
| 2006 | Maria Sharapova | Elena Dementieva | 6-1 6-2 |
| 2005 | Kim Clijsters | Lindsay Davenport | 6-4 4-6 6-2 |
| 2004 | Justine Henin | Lindsay Davenport | 6-1 6-4 |
| 2003 | Kim Clijsters | Lindsay Davenport | 6-4 7-5 |
| 2002 | Daniela Hantuchova | Martina Hingis | 6-3 6-4 |
| 2001 | Serena Williams | Kim Clijsters | 4-6 6-4 6-2 |
| 2000 | Lindsay Davenport | Martina Hingis | 4-6 6-4 6-0 |
| 1999 | Serena Williams | Steffi Graf | 6-3 3-6 7-5 |
| 1998 | Martina Hingis | Lindsay Davenport | 6-3 6-4 |
Venue & Playing Conditions
The Indian Wells Tennis Garden sits at 78-200 Miles Ave in Indian Wells, California, surrounded by the dramatic desert landscape of the Coachella Valley. The facility is purpose-built for major tennis and it shows: Stadium 1 seats 16,100 spectators, making it the second-largest tennis-specific stadium in the world, behind only the Arthur Ashe Stadium at the US Open. Stadium 2 adds another 8,000 seats, and the complex features numerous additional show courts and practice courts that give fans remarkable access to players during the early rounds.
The playing surface is Laykold hard court, classified with a medium-slow speed rating. This surface profile is critical to understanding the tournament’s statistical identity. According to TennisMattch.com’s database of 5,622 matches, the average ace count at Indian Wells is just 3.77 per match, compared to a tour-wide average of 5.00. That 24.6% reduction in aces tells you everything about how the Laykold surface plays: it gives returners extra time, rewards deep and precise serving over raw speed, and tilts rallies toward the baseline tactician. First-serve percentage at the tournament averages 60.56%, nearly identical to the tour-wide mark of 61.13%, suggesting that players aren’t struggling to get serves in — they’re simply not earning as many free points when they do.
The outdoor setting introduces a variable that indoor events never face: the desert environment. Matches played under the Coachella Valley sun experience dry air, intense heat, and low humidity. The altitude — approximately 36 feet below sea level — is negligible in terms of ball flight physics, but the heat and aridity can sap energy, particularly in afternoon sessions. Wind, while generally mild (historical averages show approximately 15.1 km/h), can occasionally swirl through the valley and disrupt ball toss rhythm, adding another layer of tactical complexity.
One of the Indian Wells Tennis Garden’s most celebrated features is its commitment to technology. It was the first tournament in the world to implement Hawk-Eye electronic line calling on every match court — not just the main stadiums, but every court where competitive matches are played. This initiative, driven by Larry Ellison’s investment in the facility, eliminated human line-calling errors across the entire draw and set a standard that the ATP and WTA tours have since adopted more broadly. For players and fans alike, it created a cleaner, more transparent competitive environment.
Beyond the tennis, the venue experience is a significant draw. The grounds feature a branch of the world-renowned Nobu restaurant, offering premium sushi with views overlooking Stadium 2. Nearby, the Coachella Valley provides a wealth of off-court attractions: the historic La Quinta Resort & Club, luxury desert spas, world-class golf courses, the high-end shopping district along El Paseo, and outdoor excursions to Joshua Tree National Park, Palm Springs, and the Santa Rosa Mountains. The Hyatt Regency Indian Wells offers convenient accommodation steps from the venue. It’s this blend of elite tennis and resort-destination lifestyle that has earned Indian Wells the “Fifth Grand Slam” nickname — and that continues to propel its attendance records to new heights.
Serve Dominance
The Anti-Ace Tournament: How Indian Wells Neutralizes Power Serving
If you want to understand what makes the BNP Paribas Open tactically distinct, start with the serve. According to TennisMattch.com’s database of 5,622 matches at Indian Wells, the average match produces just 3.77 aces. That figure sits 24.6% below the tour-wide average of 5.00 aces per match — a statistically massive gap that reshapes the competitive dynamics of every round.
This isn’t a tournament where big servers can coast on free points. The Laykold medium-slow hard court absorbs some pace off the serve, giving returners a crucial extra fraction of a second. The result: even elite servers see their ace numbers suppressed. Roger Federer, one of the most prolific servers in tennis history, averaged 5.87 aces per match across 82 career matches at Indian Wells — impressive in context, but well below what he’d typically produce on faster surfaces. Novak Djokovic averaged 4.26 aces per match across 63 matches, while Rafael Nadal managed just 2.77 aces per match over 72 contests.
Even more revealing is the comparison between players who rely on serve power versus those who rely on placement and spin. Lindsay Davenport, whose flat, penetrating serve was one of the most feared weapons in WTA history, averaged 6.50 aces per match across 60 matches at Indian Wells — the highest among the top 10 all-time players at the tournament. By contrast, Caroline Wozniacki, a player built on defensive excellence rather than serving firepower, averaged just 1.51 aces per match across 42 matches — yet still compiled a 32-10 record (76.2% win rate) and claimed 1 title.
First-Serve Accuracy and Efficiency
First-serve percentage at Indian Wells averages 60.56%, nearly mirroring the tour-wide average of 61.13%. This tells us that the surface doesn’t make it harder to land first serves — it makes it harder to win points off them. When the first serve does go in, players win 67.42% of those points, a respectable but not dominant figure that underscores how effectively returners neutralize pace.
The second-serve numbers are where vulnerability truly shows. Players win just 48.73% of second-serve points at Indian Wells, meaning that any dip in first-serve percentage immediately exposes a player to relentless return pressure. This is a tournament that punishes double faults — and the data confirms it: the average match features 3.38 double faults, essentially identical to the tour-wide mark of 3.35. Players aren’t serving more recklessly; they’re simply getting less out of each serve they make.
Year-Over-Year Serve Trends
The ace suppression effect at Indian Wells has been remarkably consistent over time. In 2008, the average match produced 3.25 aces. In 2023, it was 3.85. In 2024, it dipped to 3.31. And in 2025, it registered 3.71. Across nearly two decades of data, the average has fluctuated within a narrow band around the 3.77 overall mark, confirming that the surface — not the era or the player field — is the primary driver of ace reduction.
Double faults, meanwhile, have shown a slight upward trend in recent editions: 3.32 in 2008, rising to 3.60 in 2023, 3.66 in 2024, and 3.60 in 2025. Whether this reflects evolving playing styles, increased risk-taking on second serves, or simply natural variance requires more granular analysis — but the trend suggests that pressure on the serve at Indian Wells is, if anything, intensifying.
| Year | Matches | Avg Aces | Avg DFs | 1st Serve % | BP Conv % |
|---|---|---|---|---|---|
| 2025 | 370 | 3.7 | 3.6 | — | 45.6% |
| 2024 | 376 | 3.3 | 3.7 | 59.6% | 43.4% |
| 2023 | 378 | 3.8 | 3.6 | 60.2% | 45.1% |
| 2022 | 376 | 3.9 | 3.7 | 60.7% | 42.5% |
| 2021 | 378 | 3.1 | 3.3 | 61.4% | 45.5% |
| 2019 | 190 | 4.7 | 2.7 | 61.2% | 41.7% |
| 2018 | 190 | 5.6 | 3.3 | 59.0% | 42.8% |
| 2017 | 190 | 5.3 | 3.4 | 59.1% | 43.8% |
| 2016 | 250 | 4.1 | 3.1 | 59.9% | 44.4% |
| 2015 | 376 | 4.1 | 3.6 | 61.7% | 43.9% |
| 2014 | 374 | 3.7 | 3.4 | 60.5% | 44.8% |
| 2013 | 350 | 3.1 | 3.4 | 60.2% | 45.6% |
| 2012 | 348 | 3.3 | 3.0 | 60.7% | 46.9% |
| 2011 | 366 | 3.8 | 3.4 | 60.6% | 45.7% |
| 2010 | 370 | 3.6 | 3.0 | 61.3% | 47.8% |
| 2009 | 374 | 3.6 | 3.4 | 59.9% | 45.7% |
| 2008 | 366 | 3.2 | 3.3 | 61.5% | 46.1% |
Break Point Battles
Breaking Through: Conversion Rates at Indian Wells
In a tournament where aces are scarce and second-serve points are won less than half the time, break-point battles become the fulcrum on which matches turn. According to TennisMattch.com’s database of 5,622 matches at the BNP Paribas Open, the average break-point conversion rate is 44.98%, sitting slightly above the tour-wide average of 44.33%.
That 0.65-percentage-point gap may sound modest, but over the scale of a two-week, combined-tour event featuring hundreds of matches, it reflects a meaningful structural advantage for returners. The medium-slow Laykold surface gives return players extra time to read serves, set up return positions, and apply pressure on crucial points. The result: service games are broken more often at Indian Wells than at many other hard-court events, and the tournament consistently rewards players who can capitalize on the rare opportunities they create.
Who Converts When It Matters Most?
Among the all-time greats at Indian Wells, break-point conversion separates the good from the legendary. Novak Djokovic, the tournament’s co-king with 5 titles, converted at a 45.95% rate across 63 matches — nearly a full percentage point above the tournament average. That edge, compounded over the 6 or 7 matches needed to win the title, translates into multiple additional breaks per tournament — the kind of marginal advantage that turns semifinal losses into championship trophies.
The year-over-year break-point data reveals interesting fluctuations. In 2010, the average conversion rate reached 47.83% — a high-water mark that suggests returners were particularly dominant that year. By 2024, that figure had dropped to 43.43%, possibly reflecting improvements in serving tactics or a stronger cohort of big servers in the draw. In 2025, conversion climbed back to 45.59%, again above the tour-wide average, confirming that Indian Wells remains a returner-friendly venue.
The Tactical Implication for 2026
For players entering the BNP Paribas Open 2026, the break-point data sends a clear message: hold your serve, and you’ll win — but holding serve here is harder than almost anywhere else on the hard-court calendar. Players who arrive with elite return games and the ability to maintain concentration through long deuce games will have a structural advantage. Those who rely on winning easy points through their serve may find themselves in longer, more grueling matches than they’d prefer — with more break opportunities going against them than they’re accustomed to on tour.
The tournament’s combined format adds another dimension. WTA matches, typically featuring lower ace counts and more break-point opportunities, push the overall conversion rate upward. When analyzing ATP-only data, the break-point conversion rate likely sits closer to or slightly below the 44.33% tour average, while WTA matches push it above. This blend is part of what makes Indian Wells statistically unique: it’s one of the few tournaments where men’s and women’s data intermingle to create a composite picture of competitive tennis at the highest level.
Match Duration
How Long Do Matches Last at Indian Wells?
According to TennisMattch.com’s database, which includes duration data for 3,024 matches at the BNP Paribas Open, the average match lasts 99.17 minutes — just under the 100-minute mark. The median duration is 94 minutes, indicating that while most matches cluster around an hour and a half, a significant number of extended contests pull the average upward.
That near-100-minute average is telling. It reflects the tournament’s identity as a baseline-heavy, break-point-rich event where points are earned rather than given away. When aces are scarce (3.77 per match vs. the 5.00 tour average) and break-point conversion is above the tour norm (44.98% vs. 44.33%), matches naturally extend as players battle through more contested service games and longer rallies.
Duration by Round: The Climb to the Final
Match duration escalates predictably as the tournament deepens, but the gradient reveals how the draw structure shapes competitive intensity:
In the Round of 64, the average match lasts 97.14 minutes across 1,109 matches — the largest sample in the dataset and a reliable baseline. Round of 32 matches average 98.93 minutes (581 matches), a modest increase reflecting tighter matchups as seedings begin to hold. Round of 16 sees a jump to 100.71 minutes (293 matches), crossing the symbolic 100-minute threshold. Quarterfinals average 99.51 minutes (142 matches) — a slight dip that may reflect the dominance of top seeds dispatching overachieving lower-ranked opponents at this stage. Semifinals come in at 101.68 minutes (73 matches), climbing again as the final four contest every point with maximum intensity.
And then there are the finals. Across 37 championship matches with duration data, the average final lasts 120.59 minutes — a full two hours. That’s 21 minutes longer than the overall tournament average and nearly 24 minutes longer than the typical Round of 64 match. The jump underscores what every fan who has watched an Indian Wells final knows intuitively: the quality and competitiveness spike dramatically when trophies are on the line.
The R128 Anomaly
One curious data point stands out: Round of 128 matches average 100.33 minutes (789 matches), actually exceeding the Round of 64 and Round of 32 averages. This likely reflects the structure of the early rounds, where qualifying graduates and wild-card recipients — players with nothing to lose — play with maximum aggression against higher-seeded opponents, creating competitive matches that defy seeding expectations. The largest draw in the tournament also means more three-set matches and more WTA contests (which at this level often go the distance), pushing the average upward.
The Longest Match in Tournament History
The longest recorded match at Indian Wells lasted an extraordinary 232 minutes — nearly four hours — when Martina Trevisan defeated Marie Bouzkova 6-4, 6-7(8), 6-4 in the Round of 128 on October 6, 2021. A first-round marathon that tested both players’ physical and mental reserves, it stands as a monument to the grueling nature of competition at this event. The second-set tiebreak alone — decided at 10-8 — would have been a match unto itself at many smaller tournaments.
At the other extreme, the shortest recorded match clocked in at just 1 minute — almost certainly a retirement or walkover that nonetheless entered the statistical record.
Median match length: 94 minutes
Longest match: Martina Trevisan d. Marie Bouzkova 6-4 6-7(8) 6-4 (232 min, R128 2021)
Year-by-Year Trends
17 Years of Data: What’s Changing at Indian Wells?
TennisMattch.com’s database tracks annual statistical trends at the BNP Paribas Open spanning nearly two decades. These year-over-year numbers reveal both the tournament’s remarkable consistency and the subtle shifts that reflect broader evolution in professional tennis.
Match Volume: A Growing Event
The tournament has maintained a stable match count in recent years, typically hosting between 366 and 378 matches per edition. In 2008, there were 366 matches. By 2023, that number had risen to 378, and 2024 saw 376. The 2025 edition featured 370 matches. This consistency reflects the combined ATP/WTA draw structure, with slight annual variations driven by retirements, walkovers, and the specific draw sizes in qualifying rounds.
The Ace Plateau
As noted in the serve analysis, ace counts have remained remarkably stable over time. The numbers: 3.25 aces per match in 2008, 3.59 in 2009, 3.58 in 2010, 3.85 in 2023, 3.31 in 2024, and 3.71 in 2025. The overall tournament average of 3.77 has barely shifted despite significant changes in player physiques, racket technology, and serving techniques over the same period. This strongly suggests that the Laykold surface itself is the dominant variable — it caps ace production regardless of era.
Double Faults: A Gradual Rise
Double faults tell a slightly different story. The tournament-wide average of 3.38 per match masks a gentle upward drift: 3.32 in 2008, 3.02 in 2010 (a notable low), then 3.60 in 2023, 3.66 in 2024, and 3.60 in 2025. This approximately 10% increase from the early period to the recent period could reflect several factors: more aggressive second-serve strategies, a higher proportion of WTA matches in the combined data (WTA matches tend to feature more double faults), or simply the cumulative pressure of the medium-slow surface forcing servers into higher-risk patterns.
Break-Point Conversion: Cyclical, Not Linear
Break-point conversion rates have fluctuated rather than trended in a single direction. The 2010 edition saw a peak of 47.83%, while 2024 recorded a trough of 43.43%. The 2008 figure was 46.05%, and 2025 came in at 45.59%. These oscillations suggest that break-point dynamics are driven more by the specific mix of players in each year’s draw — particularly how many elite returners make deep runs — than by any systematic change in the tournament’s playing conditions.
First-Serve Percentage: The Steady Hand
First-serve percentage has been the most stable metric in the dataset. Where data is available, the numbers hover consistently in the 59–62% range: 61.50% in 2008, 59.92% in 2009, 61.31% in 2010, 60.23% in 2023, and 59.61% in 2024. The tournament average of 60.56% barely budges from year to year, reinforcing the notion that Indian Wells rewards consistency and strategic placement over high-risk serving.
What This Means for 2026
Based on nearly two decades of data, we can make confident predictions about the statistical profile of the BNP Paribas Open 2026. Expect ace counts in the 3.3–3.9 range, double faults near 3.5–3.7, first-serve percentages around 60%, and break-point conversion rates between 43% and 46%. These ranges have held with remarkable consistency, and barring a significant surface change or unprecedented weather disruption, the 2026 edition should conform to the tournament’s established statistical identity: a baseline-dominated, returner-friendly, tactically rich contest where depth of game matters more than firepower.
King of the BNP Paribas Open
Novak Djokovic: 5 Titles, 52 Wins, 82.5% Win Rate
Novak Djokovic is the king of the BNP Paribas Open, tied with Roger Federer at 5 titles each but separated by a statistical profile that reveals different paths to dominance. Djokovic claimed his Indian Wells crowns in 2008, 2011, 2014, 2015, and 2016 — a stretch that includes an extraordinary three consecutive titles — compiling a 52-11 record (82.5% win rate) across 63 career matches at the tournament.
According to TennisMattch.com’s database, Djokovic’s serve numbers at Indian Wells sit above the tournament average but below the tour-wide elite. He averaged 4.26 aces per match, exceeding the tournament average of 3.77 but falling short of the tour-wide 5.00. His first-serve percentage, however, paints a picture of exceptional consistency: 63.66%, a full 3 percentage points above the tournament average of 60.56%. When Djokovic found his first serve at Indian Wells, he established a platform of control that few opponents could disrupt.
But the statistic that most clearly explains Djokovic’s dominance is his break-point conversion rate: 45.95%. At a tournament where the average conversion rate is 44.98%, Djokovic operated nearly a full percentage point above the field. Over 63 matches, that margin translates into dozens of additional breaks — the compound interest of tennis excellence. His ability to convert at a high rate dovetailed with the tournament’s medium-slow surface, which gave his return game time to operate at its devastating best. Djokovic at Indian Wells was a masterclass in surface exploitation: use the slow court to extend rallies, wait for opponents to blink under pressure, and convert the opportunities that followed.
Federer: The Co-King with a Different Arsenal
Roger Federer matched Djokovic’s 5 titles at Indian Wells, but his path looked entirely different. Federer compiled a staggering 69-13 record (84.1% win rate) across 82 career matches — more wins than any other player in tournament history. His serve was a more potent weapon: Federer averaged 5.87 aces per match, the highest among the top-ranked career players at the tournament and well above both the tournament average (3.77) and even the tour-wide average (5.00). His first-serve percentage of 61.22% was solid, and when combined with his superior ace rate, it meant Federer won more free points on serve than virtually any other player in Indian Wells history.
The contrast between Djokovic and Federer at Indian Wells encapsulates their broader career rivalry: Djokovic grinded through service games with return pressure and conversion efficiency, while Federer shortened points with serve-and-volley tactics and clean winners. Both paths led to 5 titles — proof that Indian Wells, for all its returner-friendly characteristics, can be conquered by multiple styles of play.
Nadal: The Third Pillar
Rafael Nadal rounds out the Big Three at Indian Wells with 3 titles and a 60-12 record (83.3% win rate) across 72 career matches. Nadal’s ace count was predictably low — 2.77 per match — but his first-serve percentage of 64.88% was the highest among the Big Three at this event, reflecting his meticulous approach to getting the ball in play and avoiding free points for opponents. Nadal’s game was tailor-made for the medium-slow Laykold surface: his heavy topspin, exceptional court coverage, and ability to grind down opponents in baseline exchanges made Indian Wells one of his most productive non-clay events.
| Player | Record | Titles | Avg Aces |
|---|---|---|---|
| Roger Federer | 69W-13L | 5 | 5.9 |
| Rafael Nadal | 60W-12L | 3 | 2.8 |
| Novak Djokovic (Serbia) | 52W-11L | 5 | 4.3 |
| Lindsay Davenport | 48W-12L | 2 | 6.5 |
| Maria Sharapova | 38W-11L | 2 | 2.8 |
| Andre Agassi | 36W-16L | 1 | — |
| Pete Sampras | 32W-12L | 2 | — |
| Caroline Wozniacki | 32W-10L | 1 | 1.5 |
| Lleyton Hewitt | 31W-13L | 2 | 3.7 |
| Andy Murray | 31W-16L | 0 | 4.7 |
| Conchita Martinez | 28W-13L | 0 | — |
| Michael Chang | 28W-11L | 3 | — |
| Andy Roddick | 28W-10L | 0 | 9.5 |
| Martina Hingis | 27W-6L | 1 | — |
| Ana Ivanovic | 27W-9L | 1 | 3.1 |
Greatest Upsets
When Seeds Scatter: The Biggest Shocks at Indian Wells
The BNP Paribas Open’s massive draw size — featuring 96 main-draw players on each tour, plus qualifying rounds — creates an unusually large surface area for upsets. With over 5,622 matches in TennisMattch.com’s database, the tournament has produced some of the most memorable shocks in modern tennis history.
The statistical framework helps explain why upsets happen more frequently at Indian Wells than at many other Masters/WTA 1000 events. Consider the match-duration data: Round of 128 matches average 100.33 minutes, actually exceeding the average for Round of 64 (97.14 minutes) and Round of 32 (98.93 minutes). This anomaly suggests that early-round matches at Indian Wells are more competitive than seedings predict — qualifiers and unseeded players arrive in form, emboldened by the conditions, and push favored opponents to the limit.
The break-point conversion rate tells a similar story. At 44.98% — above the tour-wide average of 44.33% — the tournament creates more service breaks than many comparable events. For lower-ranked players, every additional break opportunity is a lifeline; for top seeds, every additional break-point faced is a landmine. The medium-slow surface doesn’t allow elite players to serve their way out of trouble, meaning that on any given day, a hot returner can drag a top-10 player into uncomfortable territory.
The two-week format also plays a role in upsets. Top seeds often receive first-round byes but still must play through a longer draw than at most tournaments outside the Grand Slams. Fatigue accumulates, particularly given the desert heat — historical climate data shows average highs around 23.3°C (74°F), but afternoon sessions can push significantly warmer. Players arriving from the indoor winter swing face a dramatic adjustment in conditions, and those who haven’t acclimated properly are vulnerable in the early rounds.
One instructive example comes from the tournament’s match-duration records: Martina Trevisan’s 232-minute marathon victory over Marie Bouzkova in the Round of 128 on October 6, 2021. The match’s epic length — 6-4, 6-7(8), 6-4 — epitomized the kind of dramatic, exhausting contest that the Indian Wells draw can produce in its earliest stages. While not a seeding upset per se, the match demonstrated that every round at this tournament demands full commitment, and that the physical toll of early-round battles can cascade through the draw in unpredictable ways.
The combined-tour format adds an additional dimension to the upset landscape. WTA matches at Indian Wells, with typically lower ace counts and more break opportunities, have historically produced a higher rate of seeding upsets than the ATP draw. The absence of a best-of-five-set format means that any WTA player who catches fire for two sets can topple a Grand Slam champion — and the Indian Wells surface, which suppresses serve dominance and rewards consistent ball-striking, is the perfect stage for such upsets to unfold.
Andy Murray’s Indian Wells record offers a cautionary tale for even the greatest players. Despite a career-best ATP ranking of No. 1, Murray compiled a 31-16 record (66.0% win rate) at Indian Wells and won 0 titles across 47 career matches. That 66.0% win rate is respectable but dramatically lower than Djokovic’s 82.5%, Federer’s 84.1%, or Nadal’s 83.3%. For a player of Murray’s caliber, Indian Wells was the site of more than a few upsets — proof that even the elite are vulnerable in the desert.
Rivalries
The Desert Showdowns That Defined an Era
The BNP Paribas Open has been the stage for some of the most consequential rivalries in modern tennis, magnified by the tournament’s Masters 1000/WTA 1000 status, its deep draw, and its demanding conditions. With finals averaging 120.59 minutes — over two hours of competition at the highest intensity — the championship matches at Indian Wells have produced definitive statements in tennis’s greatest head-to-head battles.
Federer vs. Djokovic: The Battle of the Co-Kings
Roger Federer and Novak Djokovic share the record with 5 titles each at Indian Wells, and their rivalry at this specific venue has been one of the sport’s great running narratives. Federer’s 82 career matches and 69 wins at the tournament represent the highest win total in the database, while Djokovic’s 52 wins and three consecutive titles (2014-2016) represent perhaps the most dominant sustained stretch in tournament history. When these two met in the Indian Wells draw, the contrast in styles was amplified by the medium-slow surface: Federer’s attacking game (5.87 aces per match) against Djokovic’s defensive wall (45.95% break-point conversion). The court became a laboratory for the sport’s most fundamental tactical debate — offense vs. defense — and both men found enough evidence to support their approach.
Federer vs. Nadal: Contrasting Paths to Indian Wells Glory
While Federer and Nadal are most associated with their clay and grass rivalries, Indian Wells provided a neutral hard court where their contrasting styles met on relatively even terms. Federer’s 5 titles versus Nadal’s 3 titles at the event tells one story; their respective records (Federer 69-13 vs. Nadal 60-12) reveals near-identical win rates (84.1% vs. 83.3%). The statistical profiles, however, diverge sharply: Federer averaged 5.87 aces per match while Nadal averaged 2.77. Yet Nadal’s first-serve percentage (64.88%) topped Federer’s (61.22%), illustrating how Nadal compensated for lower power with superior placement and consistency — a strategy the Indian Wells surface rewarded handsomely.
The Women’s Rivalries
On the WTA side, Indian Wells has hosted battles between generations of champions. Maria Sharapova (2 titles, 38-11 record) and Serena Williams (2 titles) represent one era’s defining rivalry, with their matches at Indian Wells carrying added weight due to the infamous 2001 semifinal incident that led to Williams’s boycott of the tournament from 2002 through 2014.
More recently, Iga Swiatek has emerged as a dominant force with 2 titles, while Carlos Alcaraz has similarly stamped his authority on the men’s draw with 2 titles of his own. These younger champions have begun building Indian Wells legacies that could eventually challenge the records of the Big Three — and the 2026 edition offers another opportunity to add to their tallies.
Lindsay Davenport deserves special mention as an Indian Wells rivalry figure. Her 48-12 record (80.0% win rate) across 60 matches and 2 titles made her one of the most dominant women’s players in tournament history. Her 6.50 aces per match — the highest among the all-time leaders — reflected a serve-dominant game that was unusually effective on the medium-slow surface, and her battles with contemporaries at Indian Wells were among the most compelling of her era.
Prize Money & Points
$18.83 Million: The Financial Scale of the Fifth Grand Slam
The BNP Paribas Open 2026 offers a total prize pool of $18.83 million, reinforcing its status as one of the richest non-Grand Slam events in professional tennis. The singles champion in each draw will take home $1,151,380 — a payday that exceeds the first-round prize money at several Grand Slams and rivals the earnings available at all but the most prestigious events on the global calendar.
The $18.83 million purse represents the combined investment across both the ATP and WTA draws, reflecting the tournament’s unique status as a fully combined event. Prize money is distributed across qualifying rounds, main-draw rounds, and doubles competition, with escalating payouts at each stage. For players ranked outside the top 100, simply qualifying for the main draw and winning a round or two at Indian Wells can represent a significant portion of their annual earnings — adding financial stakes to the already intense competitive pressure.
Contextualizing the Numbers
To understand the scale of $18.83 million, consider that this figure exceeds the total prize money of many ATP 500 and WTA 500 events combined. It positions Indian Wells alongside the other Masters 1000 and WTA 1000 events at the top of the non-Slam prize-money hierarchy, while the tournament’s two-week format means that players must win more matches — and endure more physical and mental strain — to claim the top prize than at most one-week events.
The prize money also reflects the tournament’s commercial success. With title sponsor BNP Paribas anchoring a roster of premium partners that includes Rolex, Emirates, BMW, Lululemon, Motorola, La Roche-Posay, and Dunlop, the event generates revenue streams that fund both the prize pool and the continuous facility upgrades that keep the Indian Wells Tennis Garden at the cutting edge. The 2025 attendance record of 504,268 fans translates directly into gate revenue that supports these investments.
Broadcasting Reach
The tournament’s financial ecosystem extends beyond on-site revenue. Broadcasting deals with Tennis Channel (USA), Sky Sports (UK), TSN (Canada), beIN SPORTS (Australia), and ESPN (South America) ensure global visibility, generating media rights fees that contribute to the overall prize-money pool. For players, this broadcast reach also translates into endorsement visibility — performing well at a globally televised event watched in every major tennis market has career-long commercial implications.
Weather & Conditions
Desert Conditions: What Players and Fans Should Expect
The BNP Paribas Open takes place in the Coachella Valley, one of the driest and sunniest regions in the United States. Based on historical climate data averaged over the past 5 years, typical March conditions in Indian Wells feature average high temperatures of 23.3°C (74°F) and average lows of 12.2°C (54°F), with virtually no precipitation — average daily rainfall measures just 0.9mm. Wind speeds average approximately 15.1 km/h, generally mild but occasionally gusting through the valley in unpredictable patterns.
However, the current 14-day forecast for the 2026 tournament period paints a significantly warmer picture. Projected average highs reach 35.9°C (96.6°F), with average lows of 22.9°C (73°F). Precipitation probability sits at a nearly negligible 0.9%, and average wind speeds are forecast at 14.6 km/h. If these forecasts hold, the 2026 edition could be one of the hottest in tournament history — a factor that will heavily influence match strategy, physical preparation, and fan comfort.
How Heat Shapes the Tennis
Extreme desert heat affects tennis in multiple ways. Ball bounce increases on hot hard courts as the surface absorbs and radiates heat, potentially adding pace and making the court play slightly faster than its medium-slow rating would suggest under cooler conditions. Players face accelerated dehydration, muscle fatigue, and the need for more frequent changeover breaks to manage body temperature. Historically, afternoon sessions at Indian Wells are the most physically demanding, and the tournament schedule typically places marquee matches in evening sessions under lights — both for player welfare and for the superior viewing experience that cooler nighttime conditions provide.
For fans attending the BNP Paribas Open 2026, the forecast temperatures make preparation essential. Sunscreen, wide-brimmed hats, and abundant water are non-negotiable for daytime sessions. The Indian Wells Tennis Garden offers ample shade in the concourse areas and food courts, and the premium seating in Stadium 1 includes some covered areas. Evening sessions — when temperatures are expected to drop into the low-to-mid 20s (°C) — will offer a more comfortable experience and have become the preferred time slot for many regular attendees.
The Wind Factor
While average wind speeds of 14.6 km/h are manageable, the Coachella Valley is surrounded by mountain passes that can channel winds unpredictably. When the wind picks up at Indian Wells, it primarily affects the serve — specifically the ball toss, which becomes harder to control in gusting conditions. This can explain the tournament’s modest ace numbers (3.77 per match vs. 5.00 tour-wide) and the slightly elevated double-fault trends observed in recent years. Players with compact, low-toss serving motions tend to handle the wind better than those with high, arching tosses — a subtle tactical advantage that becomes more pronounced on breezy days.
Rain delays are virtually unheard of at the BNP Paribas Open. The 0.9mm average daily precipitation and the near-zero precipitation probability for the 2026 period mean that scheduling disruptions from weather are exceptionally rare. This reliability is one of the tournament’s greatest operational assets, ensuring a smooth two-week schedule that rarely requires the compressed marathon days common at more weather-vulnerable events like Roland Garros or Wimbledon.
Records & Fun Facts
Records, Milestones, and Trivia from the Fifth Grand Slam
With 5,622 matches in TennisMattch.com’s database, the BNP Paribas Open has accumulated an extraordinary collection of records and milestones. Here are the most remarkable numbers and stories from five decades of tennis in the desert.
Djokovic’s Five Titles: Novak Djokovic stands alone as the most decorated champion in Indian Wells history, having claimed a record five titles at the BNP Paribas Open. His dominance includes a remarkable three consecutive titles from 2014 to 2016 — a feat of sustained excellence unmatched in the tournament’s modern era. During that three-peat stretch, his break-point conversion rate of 45.95% was a weapon as lethal as any forehand or serve. With 52 career wins in the desert, Djokovic’s combination of tactical brilliance, physical endurance, and mental fortitude has made him the undisputed king of Indian Wells, and his name is the first that comes to mind when fans think of greatness at this venue.
The 232-Minute Marathon: The longest recorded match at Indian Wells lasted 3 hours and 52 minutes when Martina Trevisan defeated Marie Bouzkova 6-4, 6-7(8), 6-4 in the Round of 128 on October 6, 2021. The second-set tiebreak — decided at 10-8 — was itself longer than many complete sets at the tournament.
Federer’s 69 Wins: Roger Federer holds the record for the most career victories at Indian Wells with 69 wins against just 13 losses across 82 matches. His 84.1% win rate over that span is the highest among any player with 50+ matches at the tournament.
Lindsay Davenport’s Ace Machine: Among the all-time top players at Indian Wells, Lindsay Davenport averaged a stunning 6.50 aces per match across 60 career matches — the highest figure among the top 10 career players in the database, and far above the tournament average of 3.77. Her flat, penetrating serve was a unique weapon on the medium-slow surface.
The Fifth Grand Slam Label: The BNP Paribas Open is widely referred to as the “Fifth Grand Slam” because it is the most-attended tennis event in the world outside of the four majors. The 2025 edition set a new record with 504,268 fans, surpassing the 2024 record of 493,440.
Players’ Favorite Tournament: Players on both the ATP and WTA tours have voted the BNP Paribas Open as their favorite Masters 1000/WTA 1000 event for a record ten consecutive years. The combination of world-class facilities, the desert resort setting, and the competitive significance of the event creates an experience that resonates across the locker room.
Stadium 1’s Scale: With a capacity of 16,100 seats, Stadium 1 at the Indian Wells Tennis Garden is the second-largest tennis-specific stadium in the world, trailing only Arthur Ashe Stadium (23,771) at the US Open.
The Nobu Experience: The Indian Wells Tennis Garden is home to a branch of the world-renowned Nobu restaurant, where fans can enjoy premium sushi with views overlooking Stadium 2. It’s perhaps the only tennis venue in the world where you can watch a world-class match while eating world-class yellowtail sashimi.
The Wozniacki Efficiency: Caroline Wozniacki averaged just 1.51 aces per match across 42 matches at Indian Wells — the lowest among the top career players — yet compiled a 32-10 record and won a title. Her success is the ultimate proof that Indian Wells rewards consistency and tactical intelligence over raw power.
The Sunshine Double: The BNP Paribas Open forms the first half of the “Sunshine Double” alongside the Miami Open. Players who win both tournaments in the same year achieve one of the most coveted accomplishments on the calendar — a feat that requires sustained excellence across four weeks, two different venues, and some of the deepest draws in non-Grand Slam tennis.
Average Winners Per Match: Players at Indian Wells average 18.62 winners per match, and the tournament’s average total points won per match is 71.68. These figures reflect the baseline-heavy nature of competition: points are contested through rallies, not ended with single-shot power plays.
Past Champions
| Year | Champion | Runner-Up | Score |
|---|---|---|---|
| 2025 | Jack Draper (United Kingdom) | Holger Rune | 0 – 2 |
| 2024 | Carlos Alcaraz (Spain) | Daniil Medvedev | 7-6(5) 6-1 |
| 2023 | Carlos Alcaraz (Spain) | Daniil Medvedev | 6-3 6-2 |
| 2022 | Taylor Fritz (USA) | Rafael Nadal | 6-3 7-6(5) |
| 2021 | Cameron Norrie (United Kingdom) | Nikoloz Basilashvili | 3-6 6-4 6-1 |
| 2019 | Dominic Thiem | Roger Federer | 3-6 6-3 7-5 |
| 2018 | Juan Martin del Potro | Roger Federer | 6-4 6-7(8) 7-6(2) |
| 2017 | Roger Federer | Stan Wawrinka | 6-4 7-5 |
| 2016 | Novak Djokovic (Serbia) | Milos Raonic | 6-2 6-0 |
| 2015 | Novak Djokovic (Serbia) | Roger Federer | 6-3 6-7(5) 6-2 |
| 2014 | Novak Djokovic (Serbia) | Roger Federer | 3-6 6-3 7-6(3) |
| 2013 | Rafael Nadal | Juan Martin del Potro | 4-6 6-3 6-4 |
| 2012 | Roger Federer | John Isner | 7-6(7) 6-3 |
| 2011 | Novak Djokovic (Serbia) | Rafael Nadal | 4-6 6-3 6-2 |
| 2010 | Ivan Ljubicic | Andy Roddick | 7-6(3) 7-6(5) |
| 2009 | Rafael Nadal | Andy Murray | 6-1 6-2 |
| 2008 | Novak Djokovic (Serbia) | Mardy Fish | 6-2 5-7 6-3 |
| 2007 | Rafael Nadal | Novak Djokovic | 6-2 7-5 |
| 2006 | Roger Federer | James Blake | 7-5 6-3 6-0 |
| 2005 | Roger Federer | Lleyton Hewitt | 6-2 6-4 6-4 |
| 2004 | Roger Federer | Tim Henman | 6-3 6-3 |
| 2003 | Lleyton Hewitt | Gustavo Kuerten | 6-1 6-1 |
| 2002 | Lleyton Hewitt | Tim Henman | 6-1 6-2 |
| 2001 | Andre Agassi | Pete Sampras | 7-6(5) 7-5 6-1 |
| 2000 | Alex Corretja | Thomas Enqvist | 6-4 6-4 6-3 |
| 1999 | Mark Philippoussis | Carlos Moya | 5-7 6-4 6-4 4-6 6-2 |
| 1998 | Marcelo Rios | Greg Rusedski | 6-3 6-7(15) 7-6(4) 6-4 |
| Year | Champion | Runner-Up | Score |
|---|---|---|---|
| 2025 | Mirra Andreeva (RUS) | Aryna Sabalenka | 1 – 2 |
| 2024 | Iga Swiatek (Poland) | Maria Sakkari | 6-4 6-0 |
| 2023 | Elena Rybakina (Kazakhstan) | Aryna Sabalenka | 7-6(11) 6-4 |
| 2022 | Iga Swiatek (Poland) | Maria Sakkari | 6-4 6-1 |
| 2021 | Paula Badosa (Spain) | Victoria Azarenka | 7-6(5) 2-6 7-6(2) |
| 2015 | Simona Halep | Jelena Jankovic | 2-6 7-5 6-4 |
| 2014 | Flavia Pennetta | Agnieszka Radwanska | 6-2 6-1 |
| 2013 | Maria Sharapova | Caroline Wozniacki | 6-2 6-2 |
| 2012 | Victoria Azarenka (BLR) | Maria Sharapova | 6-2 6-3 |
| 2011 | Caroline Wozniacki | Marion Bartoli | 6-1 2-6 6-3 |
| 2010 | Jelena Jankovic | Caroline Wozniacki | 6-2 6-4 |
| 2009 | Vera Zvonareva | Ana Ivanovic | 7-6(5) 6-2 |
| 2008 | Ana Ivanovic | Svetlana Kuznetsova | 6-4 6-3 |
| 2007 | Daniela Hantuchova | Svetlana Kuznetsova | 6-3 6-4 |
| 2006 | Maria Sharapova | Elena Dementieva | 6-1 6-2 |
| 2005 | Kim Clijsters | Lindsay Davenport | 6-4 4-6 6-2 |
| 2004 | Justine Henin | Lindsay Davenport | 6-1 6-4 |
| 2003 | Kim Clijsters | Lindsay Davenport | 6-4 7-5 |
| 2002 | Daniela Hantuchova | Martina Hingis | 6-3 6-4 |
| 2001 | Serena Williams | Kim Clijsters | 4-6 6-4 6-2 |
| 2000 | Lindsay Davenport | Martina Hingis | 4-6 6-4 6-0 |
| 1999 | Serena Williams | Steffi Graf | 6-3 3-6 7-5 |
| 1998 | Martina Hingis | Lindsay Davenport | 6-3 6-4 |
Year-by-Year Statistics
| Year | Matches | Avg Aces | Avg DFs | 1st Serve % | BP Conv % |
|---|---|---|---|---|---|
| 2025 | 370 | 3.7 | 3.6 | — | 45.6% |
| 2024 | 376 | 3.3 | 3.7 | 59.6% | 43.4% |
| 2023 | 378 | 3.8 | 3.6 | 60.2% | 45.1% |
| 2022 | 376 | 3.9 | 3.7 | 60.7% | 42.5% |
| 2021 | 378 | 3.1 | 3.3 | 61.4% | 45.5% |
| 2019 | 190 | 4.7 | 2.7 | 61.2% | 41.7% |
| 2018 | 190 | 5.6 | 3.3 | 59.0% | 42.8% |
| 2017 | 190 | 5.3 | 3.4 | 59.1% | 43.8% |
| 2016 | 250 | 4.1 | 3.1 | 59.9% | 44.4% |
| 2015 | 376 | 4.1 | 3.6 | 61.7% | 43.9% |
| 2014 | 374 | 3.7 | 3.4 | 60.5% | 44.8% |
| 2013 | 350 | 3.1 | 3.4 | 60.2% | 45.6% |
| 2012 | 348 | 3.3 | 3.0 | 60.7% | 46.9% |
| 2011 | 366 | 3.8 | 3.4 | 60.6% | 45.7% |
| 2010 | 370 | 3.6 | 3.0 | 61.3% | 47.8% |
| 2009 | 374 | 3.6 | 3.4 | 59.9% | 45.7% |
| 2008 | 366 | 3.2 | 3.3 | 61.5% | 46.1% |
All-Time Player Records
| Player | Record | Titles | Avg Aces |
|---|---|---|---|
| Roger Federer | 69W-13L | 5 | 5.9 |
| Rafael Nadal | 60W-12L | 3 | 2.8 |
| Novak Djokovic (Serbia) | 52W-11L | 5 | 4.3 |
| Lindsay Davenport | 48W-12L | 2 | 6.5 |
| Maria Sharapova | 38W-11L | 2 | 2.8 |
| Andre Agassi | 36W-16L | 1 | — |
| Pete Sampras | 32W-12L | 2 | — |
| Caroline Wozniacki | 32W-10L | 1 | 1.5 |
| Lleyton Hewitt | 31W-13L | 2 | 3.7 |
| Andy Murray | 31W-16L | 0 | 4.7 |
| Conchita Martinez | 28W-13L | 0 | — |
| Michael Chang | 28W-11L | 3 | — |
| Andy Roddick | 28W-10L | 0 | 9.5 |
| Martina Hingis | 27W-6L | 1 | — |
| Ana Ivanovic | 27W-9L | 1 | 3.1 |