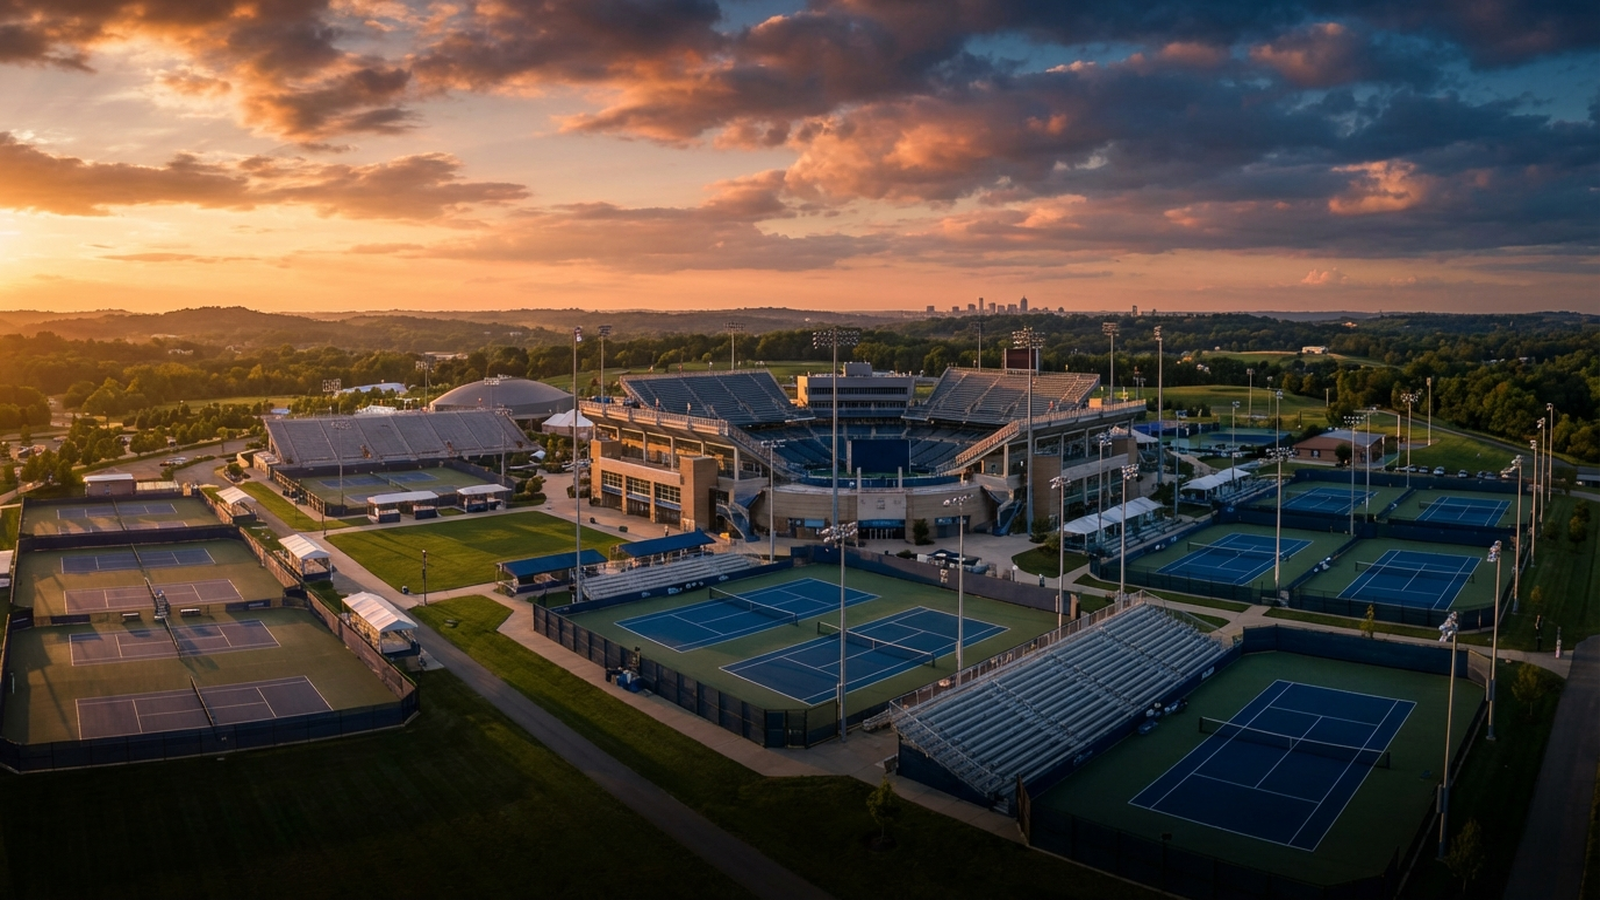
The Cincinnati Open is the oldest professional tennis tournament in the United States still played in its original host city — a distinction it has held since 1899. In 2026, the event returns to the Lindner Family Tennis Center in Mason, Ohio, carrying $14.34 million in total prize money and a freshly expanded 96-player singles draw that cements its place among the elite tier of ATP Masters 1000 and WTA 1000 events. According to TennisMattch.com’s database of 3,446 matches, this tournament has long been defined by aggressive play, tight margins, and a list of champions that reads like a who’s-who of tennis royalty.
The numbers tell the story of a uniquely demanding hardcourt event. Players at Cincinnati average 5.56 aces per match — roughly 11% higher than the tour-wide average of 5.00 — while first-serve winning percentage sits at 70.59%, suggesting that the surface rewards power and precision in equal measure. Break-point conversion, meanwhile, clocks in at 43.47%, nearly a full percentage point below the tour average of 44.33%, underscoring how difficult it is to manufacture breaks on these fast, sun-baked Ohio courts. The 2026 edition promises to be the biggest yet, following a $260 million campus transformation and a 12-day format that drew over 285,000 fans in 2025.
Roger Federer remains the tournament’s all-time king with 7 titles, a record that may stand for a generation. Novak Djokovic and Andre Agassi trail with 3 titles apiece, and current stars Carlos Alcaraz and Iga Swiatek each own 3 title as they look to build their own Cincinnati legacies. Whether you’re planning a trip to Mason, scouting the draw, or simply want to understand what makes this tournament tick, this guide covers every angle — from venue logistics and weather conditions to the deepest statistical trends hidden inside more than a century of competition.
Tournament History
The Cincinnati Open traces its origins to 1899, when it was first staged at the Avondale Athletic Club. In those early days, winners didn’t receive prize money at all — they took home items like luggage, racquets, or silver loving cups crafted by Cincinnati’s famous Rookwood Pottery. That charming, genteel beginning belies the ferocious competitiveness the event would come to embody over the next 127 years.
The tournament migrated through several venues and naming conventions over the decades. For more than two decades, it was known as the Western & Southern Open, a nod to its title sponsor, Western & Southern Financial Group, which remains a key partner. In 2024, the event reclaimed its original moniker — the Cincinnati Open — to honor the deep historic roots that make it unique on the global tennis calendar. The name change coincided with a period of extraordinary investment and reinvention.
In 1979, the tournament moved to the Lindner Family Tennis Center in Mason, Ohio, a northern suburb of Cincinnati, where it has remained ever since. That stability has allowed the venue to evolve from a modest tennis facility into one of the sport’s most impressive permanent sites. Following the acquisition of the event by Beemok Capital, a commitment was made to keep the tournament in the Cincinnati area — and to pour $260 million into a campus transformation that doubled the site’s acreage, modernized every fan-facing amenity, and dramatically upgraded player and hospitality facilities. The renovation was completed ahead of the 2025 edition, which also marked the debut of the expanded 12-day format and enlarged 96-player singles draws for both the ATP and WTA competitions.
The results were immediate: attendance soared past 285,000 in 2025, a massive leap from the 205,068 recorded during the final single-week edition in 2024. With expanded draws and an additional week of competition, the Cincinnati Open now mirrors the format of other elite Masters 1000/WTA 1000 events, positioning itself as the premier hardcourt tune-up for the US Open.
A Legacy of Champions
According to TennisMattch.com’s database of 3,446 matches, the Cincinnati Open has consistently attracted — and crowned — the very best players in the world. Roger Federer leads all players with 7 titles (2005, 2007, 2009, 2010, 2012, 2014, 2015), compiling an extraordinary 48-10 record at the event. Novak Djokovic has claimed 3 titles with a 45-12 mark, while Andre Agassi also won 3. Legends like Pete Sampras (2 titles), Mats Wilander (2 titles), Stefan Edberg (2 titles), and Andy Murray (2 titles) have all left their mark on the tournament’s honor roll.
On the women’s side, Serena Williams captured 2 titles, while the current generation has already made its presence felt: Iga Swiatek and Carlos Alcaraz each own 1 Cincinnati title, signaling that a new era of dominance may be emerging.
| Year | Champion | Runner-Up | Score |
|---|---|---|---|
| 2025 | Carlos Alcaraz (Spain) | Jannik Sinner | 0 – 0 |
| 2024 | Jannik Sinner (Italy) | Frances Tiafoe | 7-6(4) 6-2 |
| 2023 | Novak Djokovic (Serbia) | Carlos Alcaraz | 5-7 7-6(7) 7-6(4) |
| 2022 | Borna Coric | Stefanos Tsitsipas | 7-6(0) 6-2 |
| 2021 | Alexander Zverev (Germany) | Andrey Rublev | 6-2 6-3 |
| 2020 | Novak Djokovic (Serbia) | Milos Raonic | 1-6 6-3 6-4 |
| 2019 | Daniil Medvedev (RUS) | David Goffin | 7-6(3) 6-4 |
| 2018 | Novak Djokovic (Serbia) | Roger Federer | 6-4 6-4 |
| 2017 | Grigor Dimitrov (Bulgaria) | Nick Kyrgios | 6-3 7-5 |
| 2016 | Marin Cilic (Croatia) | Andy Murray | 6-4 7-5 |
| 2015 | Roger Federer | Novak Djokovic | 7-6(1) 6-3 |
| 2014 | Roger Federer | David Ferrer | 6-3 1-6 6-2 |
| 2013 | Rafael Nadal | John Isner | 7-6(8) 7-6(3) |
| 2012 | Roger Federer | Novak Djokovic | 6-0 7-6(7) |
| 2011 | Andy Murray | Novak Djokovic | 6-4 3-0 RET |
| 2010 | Roger Federer | Mardy Fish | 6-7(5) 7-6(1) 6-4 |
| 2009 | Roger Federer | Novak Djokovic | 6-1 7-5 |
| 2008 | Andy Murray | Novak Djokovic | 7-6(4) 7-6(5) |
| 2007 | Roger Federer | James Blake | 6-1 6-4 |
| 2006 | Andy Roddick | Juan Carlos Ferrero | 6-3 6-4 |
| 2005 | Roger Federer | Andy Roddick | 6-3 7-5 |
| 2004 | Andre Agassi | Lleyton Hewitt | 6-3 3-6 6-2 |
| 2003 | Andy Roddick | Mardy Fish | 4-6 7-6(3) 7-6(4) |
| 2002 | Carlos Moya | Lleyton Hewitt | 7-5 7-6(5) |
| 2001 | Gustavo Kuerten | Patrick Rafter | 6-1 6-3 |
| 2000 | Thomas Enqvist | Tim Henman | 7-6(5) 6-4 |
| 1999 | Pete Sampras | Patrick Rafter | 7-6(7) 6-3 |
| 1998 | Patrick Rafter | Pete Sampras | 1-6 7-6(2) 6-4 |
| 1997 | Pete Sampras | Thomas Muster | 6-3 6-4 |
| 1996 | Andre Agassi | Michael Chang | 7-6(4) 6-4 |
| 1995 | Andre Agassi | Michael Chang | 7-5 6-2 |
| 1994 | Michael Chang | Stefan Edberg | 6-2 7-5 |
| 1993 | Michael Chang | Stefan Edberg | 7-5 0-6 6-4 |
| Year | Champion | Runner-Up | Score |
|---|---|---|---|
| 2025 | Iga Swiatek (Poland) | Jasmine Paolini | 2 – 0 |
| 2024 | Aryna Sabalenka (BLR) | Jessica Pegula | 6-3 7-5 |
| 2023 | Coco Gauff (USA) | Karolina Muchova | 6-3 6-4 |
| 2022 | Caroline Garcia | Petra Kvitova | 6-2 6-4 |
| 2021 | Ashleigh Barty | Jil Teichmann | 6-3 6-1 |
| 2015 | Serena Williams | Simona Halep | 6-3 7-6(5) |
| 2014 | Serena Williams | Ana Ivanovic | 6-4 6-1 |
| 2013 | Victoria Azarenka (BLR) | Serena Williams | 2-6 6-2 7-6(6) |
| 2012 | Na Li | Angelique Kerber | 1-6 6-3 6-1 |
| 2011 | Maria Sharapova | Jelena Jankovic | 4-6 7-6(3) 6-3 |
| 2010 | Kim Clijsters | Maria Sharapova | 2-6 7-6(4) 6-2 |
| 2009 | Jelena Jankovic | Dinara Safina | 6-4 6-2 |
| 2008 | Nadia Petrova | Nathalie Dechy | 6-2 6-1 |
| 2007 | Anna Chakvetadze | Akiko Morigami | 6-1 6-3 |
| 2006 | Vera Zvonareva | Katarina Srebotnik | 6-2 6-4 |
| 2005 | Patty Schnyder | Akiko Morigami | 6-4 6-0 |
| 2004 | Lindsay Davenport | Vera Zvonareva | 6-3 6-2 |
Venue & Playing Conditions
The Lindner Family Tennis Center, located at 5460 Courseview Dr, Mason, OH 45040, is one of the most impressive permanent tennis facilities outside the four Grand Slams. The center court stadium seats 11,614 spectators, and the venue is one of the only tennis sites in the world — outside of Melbourne, Paris, London, and New York — to feature more than two permanent stadiums. That distinction took on even greater significance following the $260 million renovation completed ahead of the 2025 season, which doubled the facility’s acreage and added state-of-the-art player lounges, media centers, and hospitality areas.
Surface and Playing Conditions
Matches are contested on outdoor hard courts, and the surface characteristics show up clearly in the statistical record. According to TennisMattch.com’s database of 3,446 matches, players average 5.56 aces per match at Cincinnati — meaningfully above the tour-wide average of 5.00. First-serve winning percentage sits at 70.59%, while second-serve winning percentage averages 49.55%. These numbers paint the picture of a medium-to-fast hardcourt that rewards big serving and aggressive first-strike tennis but doesn’t completely shut out returners.
The court speed, combined with Cincinnati’s summer heat and humidity, creates one of the more physically demanding environments on the pre-US Open swing. The outdoor setting means matches are exposed to the elements — afternoon sun, occasional thunderstorms, and the thick Ohio River Valley humidity that can sap energy by the third set.
Location and Accessibility
Mason sits roughly 25 miles northeast of downtown Cincinnati, accessible via Interstate 71. For visitors traveling from further afield, the Cincinnati/Northern Kentucky International Airport (CVG) is approximately 40 minutes away. The venue is directly across the highway from Kings Island amusement park and the Great Wolf Lodge water park, making it an appealing destination for families. Nearby options include local restaurants in Mason, golf courses, and a 30-minute drive into downtown Cincinnati for museums, breweries, and the vibrant Over-the-Rhine neighborhood.
Parking is available on-site, and the expanded campus now accommodates the increased foot traffic that comes with the 12-day format and 285,000+ attendance figures. Shuttle services and ride-share drop-off points have also been enhanced as part of the renovation.
Serve Dominance
The Cincinnati Open has always been a server’s tournament — and the data confirms it convincingly. According to TennisMattch.com’s database of 3,446 matches, players average 5.56 aces per match at this event, compared to a tour-wide average of just 5.00. That 11.1% premium tells you everything about the court speed and bounce characteristics at the Lindner Family Tennis Center: the surface plays fast enough to reward flat, well-placed serves, and the Ohio summer heat can make the ball fly through the strike zone with extra pace.
First-Serve Dominance
First-serve percentage at Cincinnati averages 60.11%, which is slightly below the tour-wide average of 61.13%. At first glance, this might seem counterintuitive for a fast court. But it makes perfect sense: players take bigger risks on first serves here because the reward is so high. When that first serve lands, players win 70.59% of those points — a number that explains why going for broke on the first delivery is the correct tactical choice. The willingness to accept a slightly lower first-serve landing percentage in exchange for more free points when the serve does land is a hallmark of elite hardcourt strategy.
Second-serve winning percentage averages 49.55%, which is respectable but highlights the vulnerability players face when they miss the first ball. On a surface that favors the returner less than clay or slower hard courts, even the second serve maintains reasonable potency — but the gap between first-serve and second-serve point-winning rates (70.59% vs. 49.55%, a difference of 21.04 percentage points) underscores just how much the first serve matters in Cincinnati.
The Ace Kings of Cincinnati
Among the top players in the database, Andy Roddick stands out as the ultimate ace machine at this event, averaging a staggering 12.13 aces per match — more than double the tournament average. Roddick’s booming serve, one of the fastest in tennis history, was perfectly suited to Cincinnati’s conditions, and he translated that weapon into 2 titles and a 29-10 record. Roger Federer, the tournament king, averaged 7.69 aces per match — 38% above the tournament norm — while maintaining a first-serve percentage of 61.67%. Andy Murray, known more for his return game, still managed 6.79 aces per match, demonstrating that even grinders need serve weapons to succeed here.
Novak Djokovic, who has won 3 titles, averaged a more modest 5.17 aces per match — barely above the tournament average. Yet his first-serve percentage of 61.89% is the highest among the top-recorded players, suggesting that Djokovic wins in Cincinnati not through raw serve power but through precision and consistency, setting up his return game and baseline dominance with relentless accuracy on serve.
Double Faults: The Cost of Aggression
The tournament-wide average of 3.66 double faults per match is notably higher than the tour-wide average of 3.35 — a 9.3% premium that mirrors the elevated ace count. Both numbers tell the same story: players swing bigger at Cincinnati, accepting more errors in pursuit of more free points. The trade-off has proven worthwhile for the best servers in the game, but it can be punishing for players who lack the consistency to manage the risk.
In recent years, the double-fault rate has climbed even higher. The 2024 edition saw an average of 4.38 double faults per match, while the expanded 2025 edition produced 4.25. Whether this reflects changing player profiles, racket technology, or the stress of the US Open tuneup period is debatable — but the trend toward more aggressive, higher-variance serving at Cincinnati is unmistakable.
Break Point Battles
If the serve stats paint Cincinnati as a big server’s paradise, the break-point numbers add a crucial nuance: holding serve is relatively easy here, but breaking serve is unusually difficult. According to TennisMattch.com’s database of 3,446 matches, break-point conversion at the Cincinnati Open averages just 43.47% — nearly a full percentage point below the tour-wide average of 44.33%.
That 0.87-percentage-point gap may seem small in isolation, but over thousands of break-point opportunities across a tournament, it compounds dramatically. It means that for every 100 break points faced, Cincinnati servers save roughly one more than the average player on tour. In tight matches — and Cincinnati produces plenty of them — that marginal advantage translates directly into held service games and tiebreaks.
Why Breaking Is So Hard
Several factors conspire to make break-point conversion difficult in Mason. The fast surface rewards precise serving and punishes tentative returns. The 70.59% first-serve point-winning rate means that even at break point, a well-placed first serve is more likely than not to end the point immediately. And the average of 5.56 aces per match confirms that servers frequently escape break-point situations with unreturnable deliveries.
The heat and humidity add another dimension: as matches progress and fatigue accumulates, returners often find it harder to summon the explosive energy needed to attack the serve on crucial points. The server, meanwhile, can fall back on muscle memory and routine — advantages that become more pronounced as the match wears on.
Year-by-Year Trends
The break-point conversion rate has fluctuated meaningfully from year to year. In 2023, conversion spiked to 46.43% — the highest in the database’s recent sample — potentially reflecting a field that included more aggressive returners or conditions that slowed the court slightly. By 2024, it had dropped back to 43.73%, and in 2025 it settled at 44.15%, closer to the tournament’s historical norm.
Going back further, the 2010 edition saw a conversion rate of 46.82%, while the 2008 edition bottomed out at just 41.55%. These swings suggest that court conditions, draw composition, and weather all play roles in determining how many service games get broken in any given year. But the long-run average of 43.47% remains the best baseline expectation: if you’re a returner at the Cincinnati Open, you’ll convert fewer than half your break-point chances, and you’d better make each one count.
| Year | Matches | Avg Aces | Avg DFs | 1st Serve % | BP Conv % |
|---|---|---|---|---|---|
| 2025 | 372 | 6.0 | 4.3 | — | 44.2% |
| 2024 | 218 | 5.8 | 4.4 | 58.9% | 43.7% |
| 2023 | 218 | 3.8 | 4.2 | 58.9% | 46.4% |
| 2022 | 214 | 5.7 | 3.9 | 61.5% | 42.4% |
| 2021 | 220 | 6.2 | 3.4 | 61.6% | 41.6% |
| 2020 | 110 | 6.9 | 3.6 | 58.0% | 42.1% |
| 2019 | 110 | 7.0 | 3.1 | 60.7% | 42.3% |
| 2018 | 110 | 7.7 | 3.5 | 60.1% | 42.8% |
| 2017 | 110 | 8.0 | 3.4 | 59.3% | 36.3% |
| 2016 | 110 | 7.5 | 2.8 | 59.1% | 40.1% |
| 2015 | 218 | 5.2 | 3.6 | 61.1% | 43.4% |
| 2014 | 194 | 4.8 | 3.7 | 59.9% | 44.0% |
| 2013 | 216 | 4.6 | 3.8 | 60.3% | 44.9% |
| 2012 | 216 | 4.1 | 3.3 | 59.3% | 43.4% |
| 2011 | 204 | 4.4 | 3.4 | 60.1% | 45.2% |
| 2010 | 218 | 5.3 | 3.4 | 60.5% | 46.8% |
| 2009 | 216 | 5.1 | 3.3 | 60.5% | 43.5% |
| 2008 | 172 | 6.2 | 3.4 | 60.5% | 41.5% |
Match Duration
The Cincinnati Open produces matches that are, on average, slightly shorter than you might expect from a Masters 1000 event — but the variance is enormous. According to TennisMattch.com’s database of 2,081 matches with recorded durations, the average match lasts 97.36 minutes, with a median of 91 minutes. The shortest recorded match lasted just 1 minute (almost certainly a retirement), while the longest stretched to an epic 229 minutes — nearly four hours of brutal, elite-level tennis.
The Longest Match in Cincinnati History
That 229-minute marathon took place in the 2023 final, where Novak Djokovic defeated Carlos Alcaraz in a grueling three-set battle, 5-7, 7-6(7), 7-6(4). The match was a masterclass in attrition and nerve: Alcaraz took the first set, Djokovic clawed back in a second-set tiebreak that went to 9-7, and the Serbian legend closed it out with a cleaner tiebreak in the deciding set. At 3 hours and 49 minutes, it remains the longest match in the tournament’s modern database — a fitting showcase for what many consider the defining rivalry of the 2020s.
Duration by Round
Match length at Cincinnati follows a pattern that defies simple assumptions. Semifinals are the longest round, averaging 107.39 minutes across 74 recorded matches — roughly 10 minutes longer than the tournament average. This makes intuitive sense: the semifinal stage brings together four elite players, all of whom have survived multiple rounds and are playing at peak intensity. The stakes are high enough to produce caution, yet both players are confident enough to extend rallies and fight for every point.
Finals average 102.87 minutes across 38 matches, making them the second-longest round. The slight dip from the semifinals may reflect the dynamic of championship matches, where one player occasionally dominates (Federer won many of his 7 Cincinnati finals in relatively brisk fashion).
Earlier rounds are more compressed: Round of 32 matches average 97.60 minutes, Round of 64 averages 96.81 minutes, Round of 16 comes in at 96.36 minutes, and quarterfinals at 95.40 minutes. The quarterfinals being the shortest of the later rounds is a mild surprise, but it may reflect the tendency for top seeds to hit their stride by the third or fourth round, dispatching opponents more efficiently before the survival-mode intensity of the semifinals kicks in.
Median match length: 91 minutes
Longest match: Novak Djokovic d. Carlos Alcaraz 5-7 7-6(7) 7-6(4) (229 min, F 2023)
Year-by-Year Trends
The Cincinnati Open’s statistical fingerprint has evolved meaningfully over the past two decades, reflecting broader shifts in tennis technology, athleticism, and strategy. According to TennisMattch.com’s database, the trends reveal a tournament that is becoming more volatile, more physical, and — with the expanded format — significantly larger in scale.
The Draw Expansion Effect
The most dramatic structural change is visible in the match counts. From 2008 through 2024, the tournament consistently featured around 218 matches per edition (with minor fluctuations due to qualifying and walkovers). In 2025, following the expansion to a 12-day format and 96-player singles draws, the match count surged to 372 — a 70.6% increase from the 2024 edition’s 218 matches. This expansion doesn’t just mean more tennis; it fundamentally changes the tournament’s statistical texture by including more matches between lower-ranked players, which can shift averages in unpredictable ways.
Aces and Double Faults: A Rising Risk Profile
Ace counts have fluctuated significantly. The 2008 edition featured an average of 6.22 aces per match — the highest in the sample — while 2023 saw a dip to just 3.78. By 2024, the average had recovered to 5.77, and the expanded 2025 draw produced 5.99 aces per match. The 2023 anomaly is notable and may reflect specific draw composition or slightly different court conditions that year.
Double faults tell a clearer story of escalation. In 2008, the average was 3.45 per match. By 2009, it was 3.28. But from 2023 onward, the numbers jump: 4.21 in 2023, 4.38 in 2024, and 4.25 in 2025. This sustained increase in double faults, paired with the aces data, suggests that modern players are serving with more aggression and accepting more variance — a strategic evolution that aligns with the broader trend toward first-strike tennis across the ATP and WTA tours.
First-Serve Percentage: Holding Steady, Then Dropping
First-serve percentage hovered around 60.5% for much of the late 2000s and into the 2010s — 60.48% in 2008, 60.50% in 2009, 60.48% in 2010. By 2023 and 2024, the number had drifted lower: 58.88% and 58.92%, respectively. This roughly 1.5-percentage-point decline over 15 years may seem modest, but it aligns with the rising double-fault rate and reinforces the narrative of increasing serve aggression. Players are going for more on their first serves, landing fewer, but winning more when they do connect.
Break-Point Conversion: Cyclical, Not Linear
Break-point conversion rates don’t show a clean linear trend but rather cycle between higher and lower periods. The 2008 edition saw just 41.55% conversion, rising to 46.82% in 2010, dipping to 43.54% in 2009, then spiking again to 46.43% in 2023 before settling at 43.73% in 2024 and 44.15% in 2025. The tournament’s long-run average of 43.47% remains a reliable benchmark, but individual years can deviate by 3-5 percentage points in either direction — a reminder that small sample sizes within a single edition can produce significant variance.
| Year | Matches | Avg Aces | Avg DFs | 1st Serve % | BP Conv % |
|---|---|---|---|---|---|
| 2025 | 372 | 6.0 | 4.3 | — | 44.2% |
| 2024 | 218 | 5.8 | 4.4 | 58.9% | 43.7% |
| 2023 | 218 | 3.8 | 4.2 | 58.9% | 46.4% |
| 2022 | 214 | 5.7 | 3.9 | 61.5% | 42.4% |
| 2021 | 220 | 6.2 | 3.4 | 61.6% | 41.6% |
| 2020 | 110 | 6.9 | 3.6 | 58.0% | 42.1% |
| 2019 | 110 | 7.0 | 3.1 | 60.7% | 42.3% |
| 2018 | 110 | 7.7 | 3.5 | 60.1% | 42.8% |
| 2017 | 110 | 8.0 | 3.4 | 59.3% | 36.3% |
| 2016 | 110 | 7.5 | 2.8 | 59.1% | 40.1% |
| 2015 | 218 | 5.2 | 3.6 | 61.1% | 43.4% |
| 2014 | 194 | 4.8 | 3.7 | 59.9% | 44.0% |
| 2013 | 216 | 4.6 | 3.8 | 60.3% | 44.9% |
| 2012 | 216 | 4.1 | 3.3 | 59.3% | 43.4% |
| 2011 | 204 | 4.4 | 3.4 | 60.1% | 45.2% |
| 2010 | 218 | 5.3 | 3.4 | 60.5% | 46.8% |
| 2009 | 216 | 5.1 | 3.3 | 60.5% | 43.5% |
| 2008 | 172 | 6.2 | 3.4 | 60.5% | 41.5% |
King of the Cincinnati Open
Roger Federer won 7 Cincinnati Open titles — more than any other player in the tournament’s history, and a record that may stand for decades. His reign stretched from 2005 to 2015, a decade of dominance that saw him compile a 48-10 record (82.8% win rate) at the Lindner Family Tennis Center. According to TennisMattch.com’s database, no other player comes close to matching both his title count and his sustained excellence at this event.
The Numbers Behind the Dominance
Federer’s serve statistics at Cincinnati tell the story of a player perfectly calibrated for fast hardcourt tennis. He averaged 7.69 aces per match — 38.4% above the tournament average of 5.56 — while maintaining a first-serve percentage of 61.67%, slightly above the tournament norm of 60.11%. That combination of accuracy and power meant that opponents rarely got a foothold against his serve, and when they did manufacture break-point opportunities, Federer’s break-point conversion rate of 39.71% on the offensive end tells only part of the story. What the raw conversion number doesn’t capture is how few break points he allowed: his service games were fortresses.
The seven titles came in waves. Federer first conquered Cincinnati in 2005, during the peak of his first era of dominance. He added a second crown in 2007, then won back-to-back in 2009 and 2010. After a brief hiatus, he returned to claim three more in 2012, 2014, and 2015 — a late-career surge that demonstrated his remarkable ability to adapt his game to evolving competition. No other player in the Open Era has won the Cincinnati title more than four times.
How Federer Compares to Other Cincinnati Greats
The closest challengers in title count are Mats Wilander with 7 titles, and a group of three-time champions: Novak Djokovic, Andre Agassi, and Pete Sampras. Djokovic, who shares with Federer the distinction of having won more than 40 matches at the tournament (45 wins, 12 losses), is the active player with the best chance of narrowing the gap — but even he would need to win four more titles to match Federer’s record.
Stefan Edberg posted a remarkable 45-11 record at Cincinnati (80.4% win rate) with 7 titles, while Jimmy Connors went 39-10 (79.6%) with 7 title. Both players were Cincinnati favorites whose records underscore how difficult it is to convert consistent performance into titles at this level. Michael Chang (41-14, 2 titles) and Andy Murray (35-15, 2 titles) further illustrate the point: longevity and quality don’t guarantee championships.
Federer’s 82.8% win rate is the highest among players with 50+ matches at the tournament, and his 48 victories represent the outright record. Combined with his 7 titles, these numbers establish him not just as the Cincinnati Open’s greatest champion but as one of the most dominant player-tournament combinations in all of professional tennis.
| Player | Record | Titles | Avg Aces |
|---|---|---|---|
| Roger Federer | 48W-10L | 7 | 7.7 |
| Stefan Edberg | 45W-11L | 2 | — |
| Novak Djokovic (Serbia) | 45W-12L | 3 | 5.2 |
| Michael Chang | 41W-14L | 2 | — |
| Jimmy Connors | 39W-10L | 1 | — |
| Pete Sampras | 38W-11L | 3 | — |
| Mats Wilander | 36W-7L | 4 | — |
| Andy Murray | 35W-15L | 2 | 6.8 |
| Andre Agassi | 31W-10L | 3 | — |
| Andy Roddick | 29W-10L | 2 | 12.1 |
| Lleyton Hewitt | 28W-11L | 0 | 5.6 |
| Stan Smith | 26W-9L | 1 | — |
| Harold Solomon | 25W-7L | 2 | — |
| Jelena Jankovic | 25W-8L | 1 | 3.6 |
| Brad Gilbert | 24W-7L | 1 | — |
Greatest Upsets
For all its reputation as a tournament that rewards elite serve-and-volley play and top-seed dominance, the Cincinnati Open has produced some staggering upsets over its long history. The fast hardcourt surface, combined with the physical demands of the late-summer swing and the expanded draw that now includes 96 players, creates conditions where lower-ranked players can occasionally ride a hot serve and a day of exceptional timing to topple a giant.
The Tiebreak Factor
One of the statistical signatures of Cincinnati upsets is the tiebreak. With break-point conversion averaging just 43.47% — below the tour average of 44.33% — matches frequently go to tiebreaks, where anything can happen in a compressed sample of points. The 2023 final between Djokovic and Alcaraz is the most dramatic example: even at the highest level, two of the three sets were decided by tiebreaks, and the match stretched to a tournament-record 229 minutes. If the two best players in the world can be separated by just a handful of points in a tiebreak, imagine the volatility when a big-serving qualifier faces a top-10 seed in the Round of 64.
Early-Round Vulnerability
The match-duration data offers an indirect lens on upset potential. Round of 64 matches average 96.81 minutes — only about 30 seconds shorter than Round of 32 matches (97.60 minutes). This near-equivalence suggests that first-round matches in Cincinnati are contested more closely than you might expect, with lower-ranked players pushing top seeds deep into sets. The relatively short average in the quarterfinals (95.40 minutes) hints that by that stage, the survivors have typically found their rhythm — but the first two rounds remain danger zones.
The Expanded Draw: More Opportunity for Chaos
The 2025 expansion to 96 players — reflected in that year’s surge to 372 total matches, up from 218 in 2024 — injected significantly more early-round matches into the tournament. More matches mean more opportunities for surprises. With additional qualifiers and lower-ranked players entering the main draw, the probability of at least one marquee upset in the opening rounds has increased substantially. The 2026 edition, with its second year of the expanded format, will be a fascinating test case: will the top seeds adapt to the longer tournament, or will the deeper draw continue to spring surprises?
History suggests that Cincinnati’s fast surface doesn’t discriminate. It can elevate an underdog with a huge serve just as easily as it can carry a Federer or Djokovic to a comfortable victory. The margins are razor-thin, and the database confirms it: a tournament-wide break-point conversion rate below 44% means that on any given day, the better server — not necessarily the higher-ranked player — has the edge.
Rivalries
The Cincinnati Open has served as a crucible for some of tennis’s most iconic rivalries, its fast hardcourt surface and late-summer timing ensuring that the sport’s biggest names clash year after year in high-stakes encounters just weeks before the US Open.
Djokovic vs. Alcaraz: The Modern Defining Rivalry
The longest match in Cincinnati’s modern database — 229 minutes — belongs to the 2023 final between Novak Djokovic and Carlos Alcaraz. Djokovic won 5-7, 7-6(7), 7-6(4) in a match that epitomized the generational clash between the sport’s greatest active player and its most electrifying young talent. The fact that Alcaraz took the first set, only for Djokovic to battle back through two agonizing tiebreaks, showcased the Serbian’s legendary mental fortitude and Alcaraz’s fearless aggression. Both players own Cincinnati titles — Djokovic with 3, Alcaraz with 1 — and their meetings in Mason have become must-watch events on the tennis calendar.
Federer’s Dominance: A Rivalry with the Tournament Itself
In some ways, Roger Federer’s greatest rivalry at Cincinnati was with the tournament’s own difficulty. His 7 titles and 48-10 record represent a level of dominance that few players have achieved at any single event. Federer faced — and regularly dispatched — the best players of multiple generations at the Lindner Family Tennis Center. His 82.8% win rate across 58 matches is the highest among the top-20 all-time players in the database, and his ability to win titles in 2005 and again in 2015 speaks to a decade-long supremacy that spanned rivals from Andy Roddick and Rafael Nadal to Novak Djokovic and Andy Murray.
Murray vs. Djokovic: The Masters 1000 Battleground
Andy Murray and Novak Djokovic turned Cincinnati into one of their many battlegrounds during the 2010s. Murray’s 2 titles and 35-15 record at the event (70.0% win rate) made him a consistent contender, while Djokovic’s 3 titles and 45-12 record (78.9%) gave the Serbian a clear statistical edge. Their contrasting styles — Murray’s relentless defending and Djokovic’s elastic-court coverage — produced tense, tactical encounters that often hinged on the break-point conversion margins that define Cincinnati tennis. With both players averaging first-serve percentages above 57% at this event (Murray at 57.38%, Djokovic at 61.89%), their matches often came down to who could manufacture those rare breaks.
Sampras and Agassi: The ’90s Blueprint
Before Federer and Djokovic, Pete Sampras and Andre Agassi established Cincinnati as a stage for their legendary rivalry. Sampras compiled a 38-11 record with 2 titles, relying on his devastating serve to overpower opponents on the fast Cincinnati surface. Agassi countered with his own 31-10 record and 3 titles, using his revolutionary return game to neutralize even the biggest servers. Their Cincinnati duels in the 1990s were previews for their US Open clashes and embodied the serve-vs.-return dynamic that continues to define this tournament’s tactical landscape.
Prize Money & Points
The Cincinnati Open 2026 offers $14.34 million in total prize money, reflecting the tournament’s status as one of the richest events on the combined ATP Masters 1000 and WTA 1000 calendar. The singles champion on the ATP side will earn $1,124,380, while the WTA singles champion takes home $752,275. These figures represent a significant investment by the tournament’s organizers and sponsors, and they position Cincinnati among the most lucrative non-Grand Slam events in professional tennis.
Context and Comparisons
The $14.34 million total purse is a reflection of the broader economic boom in professional tennis. Combined with the $260 million campus renovation and the expansion to a 12-day format, the prize money signals the Cincinnati Open’s ambition to compete not just on the court but in the marketplace of global sporting events. The tournament’s roster of sponsors — including Credit One Bank, Fifth Third, Great American Insurance Group, Kroger, Procter & Gamble, Western & Southern Financial Group, and Veroni — provides a corporate backing infrastructure that supports both the prize fund and the fan experience.
What Players Are Really Playing For
Beyond the paycheck, the Cincinnati Open carries 1,000 ATP ranking points for the men’s champion and equivalent WTA points for the women’s winner. For players on the bubble of year-end qualifying events — whether it’s the ATP Finals, WTA Finals, or seeding for the US Open — Cincinnati’s points haul can be career-defining. The tournament’s position in the calendar, just two weeks before the US Open, means that a deep run in Mason can vault a player from outside the top 8 into a favorable Grand Slam seeding, alter round-robin group assignments for the year-end championships, and generate the kind of confidence and match-play sharpness that translates directly to Flushing Meadows.
The prize money distribution cascades down through the rounds, ensuring that even early-round losers receive meaningful compensation. For qualifiers and lower-ranked players who benefit from the expanded 96-player draw, a first-round appearance at Cincinnati can represent one of the most important paychecks of the year — a financial lifeline that sustains careers outside the top 50.
Weather & Conditions
The Cincinnati Open takes place in mid-August, when southwestern Ohio is in the grip of its hottest and most humid stretch of the year. According to 5-year historical climate data for Mason, Ohio, the average daily high temperature during the tournament window is 28.6°C (83.5°F), with overnight lows averaging 18.8°C (65.8°F). These are conditions that test endurance, hydration, and mental toughness — especially in matches that stretch beyond two hours.
Humidity: The Hidden Opponent
The numbers only tell part of the story. Mason sits in the Ohio River Valley, a geographic basin that traps moisture and produces oppressive humidity levels that can make the perceived temperature feel 5-10 degrees hotter than the actual reading. For players accustomed to the dry heat of the Middle Eastern swing or the temperate conditions of European clay season, Cincinnati’s humidity represents a genuine physiological challenge. Average daily precipitation is 3.5mm, and while outright washout days are relatively rare, afternoon thunderstorms are a regular occurrence during the tournament fortnight, leading to schedule disruptions and compressed evening sessions.
Wind and Its Impact on Play
Historical average wind speeds run around 14.0 km/h — moderate by most standards but enough to affect ball flight on the exposed outdoor courts. The Lindner Family Tennis Center’s main stadium offers some wind protection, but outer courts are more susceptible to gusts, which can disrupt serve tosses and introduce an additional variable into point construction. Given that Cincinnati’s serve stats already show elevated aces (5.56 per match) and double faults (3.66 per match), even modest wind can amplify the serve variance that characterizes this tournament.
Planning Your Visit
Fans attending the Cincinnati Open 2026 should prepare for hot, humid conditions by bringing sunscreen, hats, and portable fans. Hydration is essential — the venue offers water stations throughout the grounds — and lightweight, breathable clothing is recommended. Afternoon sessions can be particularly punishing, with direct sun exposure on the uncovered upper decks. Evening sessions offer some relief as temperatures dip into the mid-20s Celsius (upper 70s Fahrenheit), and the atmosphere under the lights at center court is one of the best experiences on the ATP/WTA calendar.
While rain delays are possible, the tournament has historically managed its schedule effectively, using the flexibility of day and night sessions to accommodate weather disruptions. The expanded 12-day format also provides additional scheduling cushion that wasn’t available during the single-week era.
Records & Fun Facts
The Cincinnati Open is a tournament steeped in tradition, quirks, and records that reflect its status as the oldest professional tennis event in America still played in its original city. Here are the numbers and stories that make it unique.
Records and Milestones
Roger Federer’s 7 titles are the most by any player in the tournament’s history. His 48 wins are also the all-time record, as is his 82.8% win rate among players with 50+ matches. His decade of dominance (2005-2015) saw him win the title 7 times in 11 years — a rate of championship-winning that few players have achieved at any single event in the Open Era.
Oldest active tournament in its original city: Founded in 1899, the Cincinnati Open predates the Australian Open (1905 in its current form), the French Open’s move to Roland Garros (1928), and the US Open’s move to Flushing Meadows (1978). No other American professional tennis tournament has been played in the same city for 127 consecutive years.
The 229-minute epic: The 2023 final between Novak Djokovic and Carlos Alcaraz, decided 5-7, 7-6(7), 7-6(4), is the longest match in the tournament’s modern database. Every set was competitive, with two of three decided by tiebreaks, and the match took nearly four hours to complete.
Mats Wilander’s efficiency: The Swedish great posted a 36-7 record at Cincinnati (83.7% win rate) with 7 titles — the second-highest title count in the database. His win rate is actually higher than Federer’s, though in a smaller sample of 43 total matches compared to Federer’s 58.
Traditions and Trivia
The Victory Balls: One of Cincinnati’s most beloved traditions sees winning players autograph tennis balls and hit them into the crowd after their matches. It’s a simple gesture that has become a signature moment at the tournament, creating tangible souvenirs for fans and a feel-good ritual for players.
No prize money? No problem: In the tournament’s earliest years, champions didn’t receive prize money. Instead, they won items like luggage, racquets, or silver loving cups made by Cincinnati’s famous Rookwood Pottery — a local artisanal treasure that has since become highly collectible.
More stadiums than almost anyone: The Lindner Family Tennis Center is one of the only tennis venues in the world outside the four Grand Slams to feature more than two permanent stadiums. The $260 million renovation completed in 2025 only enhanced this distinction.
From 205,068 to 285,000+: Attendance jumped roughly 39% from 2024 to 2025 following the expansion to a 12-day format, demonstrating the massive appetite for live tennis in the Cincinnati market. The 2026 edition will look to build on those numbers in only the second year of the expanded schedule.
Jimmy Connors’ efficiency: The American legend posted a 39-10 record at Cincinnati (79.6% win rate) but managed only 2 titles — a reminder of how difficult it is to convert consistent performance into championships at an event that attracts the world’s best players every year.
Andy Roddick’s serve: With an average of 12.13 aces per match — more than double the tournament average of 5.56 — Roddick was the most dominant server in Cincinnati history among players with significant match records. His 2 titles and 29-10 record were built almost entirely on the back of that legendary delivery.
Past Champions
| Year | Champion | Runner-Up | Score |
|---|---|---|---|
| 2025 | Carlos Alcaraz (Spain) | Jannik Sinner | 0 – 0 |
| 2024 | Jannik Sinner (Italy) | Frances Tiafoe | 7-6(4) 6-2 |
| 2023 | Novak Djokovic (Serbia) | Carlos Alcaraz | 5-7 7-6(7) 7-6(4) |
| 2022 | Borna Coric | Stefanos Tsitsipas | 7-6(0) 6-2 |
| 2021 | Alexander Zverev (Germany) | Andrey Rublev | 6-2 6-3 |
| 2020 | Novak Djokovic (Serbia) | Milos Raonic | 1-6 6-3 6-4 |
| 2019 | Daniil Medvedev (RUS) | David Goffin | 7-6(3) 6-4 |
| 2018 | Novak Djokovic (Serbia) | Roger Federer | 6-4 6-4 |
| 2017 | Grigor Dimitrov (Bulgaria) | Nick Kyrgios | 6-3 7-5 |
| 2016 | Marin Cilic (Croatia) | Andy Murray | 6-4 7-5 |
| 2015 | Roger Federer | Novak Djokovic | 7-6(1) 6-3 |
| 2014 | Roger Federer | David Ferrer | 6-3 1-6 6-2 |
| 2013 | Rafael Nadal | John Isner | 7-6(8) 7-6(3) |
| 2012 | Roger Federer | Novak Djokovic | 6-0 7-6(7) |
| 2011 | Andy Murray | Novak Djokovic | 6-4 3-0 RET |
| 2010 | Roger Federer | Mardy Fish | 6-7(5) 7-6(1) 6-4 |
| 2009 | Roger Federer | Novak Djokovic | 6-1 7-5 |
| 2008 | Andy Murray | Novak Djokovic | 7-6(4) 7-6(5) |
| 2007 | Roger Federer | James Blake | 6-1 6-4 |
| 2006 | Andy Roddick | Juan Carlos Ferrero | 6-3 6-4 |
| 2005 | Roger Federer | Andy Roddick | 6-3 7-5 |
| 2004 | Andre Agassi | Lleyton Hewitt | 6-3 3-6 6-2 |
| 2003 | Andy Roddick | Mardy Fish | 4-6 7-6(3) 7-6(4) |
| 2002 | Carlos Moya | Lleyton Hewitt | 7-5 7-6(5) |
| 2001 | Gustavo Kuerten | Patrick Rafter | 6-1 6-3 |
| 2000 | Thomas Enqvist | Tim Henman | 7-6(5) 6-4 |
| 1999 | Pete Sampras | Patrick Rafter | 7-6(7) 6-3 |
| 1998 | Patrick Rafter | Pete Sampras | 1-6 7-6(2) 6-4 |
| 1997 | Pete Sampras | Thomas Muster | 6-3 6-4 |
| 1996 | Andre Agassi | Michael Chang | 7-6(4) 6-4 |
| 1995 | Andre Agassi | Michael Chang | 7-5 6-2 |
| 1994 | Michael Chang | Stefan Edberg | 6-2 7-5 |
| 1993 | Michael Chang | Stefan Edberg | 7-5 0-6 6-4 |
| Year | Champion | Runner-Up | Score |
|---|---|---|---|
| 2025 | Iga Swiatek (Poland) | Jasmine Paolini | 2 – 0 |
| 2024 | Aryna Sabalenka (BLR) | Jessica Pegula | 6-3 7-5 |
| 2023 | Coco Gauff (USA) | Karolina Muchova | 6-3 6-4 |
| 2022 | Caroline Garcia | Petra Kvitova | 6-2 6-4 |
| 2021 | Ashleigh Barty | Jil Teichmann | 6-3 6-1 |
| 2015 | Serena Williams | Simona Halep | 6-3 7-6(5) |
| 2014 | Serena Williams | Ana Ivanovic | 6-4 6-1 |
| 2013 | Victoria Azarenka (BLR) | Serena Williams | 2-6 6-2 7-6(6) |
| 2012 | Na Li | Angelique Kerber | 1-6 6-3 6-1 |
| 2011 | Maria Sharapova | Jelena Jankovic | 4-6 7-6(3) 6-3 |
| 2010 | Kim Clijsters | Maria Sharapova | 2-6 7-6(4) 6-2 |
| 2009 | Jelena Jankovic | Dinara Safina | 6-4 6-2 |
| 2008 | Nadia Petrova | Nathalie Dechy | 6-2 6-1 |
| 2007 | Anna Chakvetadze | Akiko Morigami | 6-1 6-3 |
| 2006 | Vera Zvonareva | Katarina Srebotnik | 6-2 6-4 |
| 2005 | Patty Schnyder | Akiko Morigami | 6-4 6-0 |
| 2004 | Lindsay Davenport | Vera Zvonareva | 6-3 6-2 |
Year-by-Year Statistics
| Year | Matches | Avg Aces | Avg DFs | 1st Serve % | BP Conv % |
|---|---|---|---|---|---|
| 2025 | 372 | 6.0 | 4.3 | — | 44.2% |
| 2024 | 218 | 5.8 | 4.4 | 58.9% | 43.7% |
| 2023 | 218 | 3.8 | 4.2 | 58.9% | 46.4% |
| 2022 | 214 | 5.7 | 3.9 | 61.5% | 42.4% |
| 2021 | 220 | 6.2 | 3.4 | 61.6% | 41.6% |
| 2020 | 110 | 6.9 | 3.6 | 58.0% | 42.1% |
| 2019 | 110 | 7.0 | 3.1 | 60.7% | 42.3% |
| 2018 | 110 | 7.7 | 3.5 | 60.1% | 42.8% |
| 2017 | 110 | 8.0 | 3.4 | 59.3% | 36.3% |
| 2016 | 110 | 7.5 | 2.8 | 59.1% | 40.1% |
| 2015 | 218 | 5.2 | 3.6 | 61.1% | 43.4% |
| 2014 | 194 | 4.8 | 3.7 | 59.9% | 44.0% |
| 2013 | 216 | 4.6 | 3.8 | 60.3% | 44.9% |
| 2012 | 216 | 4.1 | 3.3 | 59.3% | 43.4% |
| 2011 | 204 | 4.4 | 3.4 | 60.1% | 45.2% |
| 2010 | 218 | 5.3 | 3.4 | 60.5% | 46.8% |
| 2009 | 216 | 5.1 | 3.3 | 60.5% | 43.5% |
| 2008 | 172 | 6.2 | 3.4 | 60.5% | 41.5% |
All-Time Player Records
| Player | Record | Titles | Avg Aces |
|---|---|---|---|
| Roger Federer | 48W-10L | 7 | 7.7 |
| Stefan Edberg | 45W-11L | 2 | — |
| Novak Djokovic (Serbia) | 45W-12L | 3 | 5.2 |
| Michael Chang | 41W-14L | 2 | — |
| Jimmy Connors | 39W-10L | 1 | — |
| Pete Sampras | 38W-11L | 3 | — |
| Mats Wilander | 36W-7L | 4 | — |
| Andy Murray | 35W-15L | 2 | 6.8 |
| Andre Agassi | 31W-10L | 3 | — |
| Andy Roddick | 29W-10L | 2 | 12.1 |
| Lleyton Hewitt | 28W-11L | 0 | 5.6 |
| Stan Smith | 26W-9L | 1 | — |
| Harold Solomon | 25W-7L | 2 | — |
| Jelena Jankovic | 25W-8L | 1 | 3.6 |
| Brad Gilbert | 24W-7L | 1 | — |